New Articles

New Rare Earth Mining Projects to Weaken China’s Leading Market Hold

earth

New Rare Earth Mining Projects to Weaken China’s Leading Market Hold

IndexBox has just published a new report: ‘World – Rare Earth Metals – Market Analysis, Forecast, Size, Trends and Insights’. Here is a summary of the report’s key findings.

The global demand for rare earths is continuing to increase. Countries remain reliant on China, which currently provides approx. 55% of global rare earth production. Future projects to develop mining facilities in Russia, the U.S., Japan and Australia may yet weaken China’s leading market hold. The rare earth mineral market is to accelerate on robustly increasing demand from the microelectronics, electric vehicle, wind power and high-tech industries.

Key Trends and Insights

Global rare earth mineral output continues to increase. According to USGS data, global production in 2020 reached 240К tonnes (+9% y-o-y). China leads the output of rare earth minerals, with a figure of 140К tonnes in 2020 (+6% y-o-y). In addition, China boasts the largest confirmed rare earth mineral reserves in the world (44М tonnes). Output is also on the rise in the U.S. (+35.7% y-o-y), Brazil (+40.8% y-o-y), Myanmar (+20% y-o-y), Burundi (+150% y-o-y), India (+3.4% y-o-y), and Madagascar (+100% y-o-y).

The substantial dependence on China, which accounts for 55% of global rare earth production, makes other countries strategically vulnerable: these minerals are widely used in the semiconductor industry, nuclear engineering, mechanical engineering, the chemical industry and metallurgy. China’s decision to restrict exports of rare earth minerals to any particular country could have a serious impact, particularly in terms of their hi-tech industries.

The planned construction of new facilities in several countries worldwide should alleviate the global reliance on Chinese exports. The most significant confirmed reserves are recognized in Vietnam (22М tonnes), Brazil (21М tonnes), Russia (12М tonnes), India (6.9М tonnes), Australia (4.1М tonnes), the U.S. (1.5М tonnes) and Greenland (1.5М tonnes). Given these considerable resources, a shortage of rare earth minerals is not envisaged in the medium term, but it will require tangible investments to make the substantial increase in production feasible.

The Russian government intends to increase its share of production on the global market from 1.3% to 10% by 2030. Investment currently stands at $1.5В and is being directed into 11 rare earth development projects; mining taxes and loan interest rates for involved businesses are being cut.

The U.S., Sweden, Japan, Tanzania, Namibia, Angola, South Africa, South Korea and Australia have also announced plans to establish new production facilities. The construction of a mining facility at one of the world’s largest deposits in Greenland could impact significantly on the global rare earths market. Despite the extensive potential, the resistance from residents regarding the possible threat to the environment has prevented the project from moving forward.

In 2021, Canada launched its first rare earth mining enterprise. The projected output of the Canadian plant is set to reach 5K tonnes of contained rare earth oxides by 2025.

The rare earth metal market is forecast to expand to 313K tonnes by 2030. Demand for rare earth magnets from expanding electric vehicle, electronic and wind power industries will be the main market driver. The use of these metals in low-carbon technologies should further stimulate their consumption.

Global Rare Earth Metal Production

In 2020, global rare earth metal production expanded modestly to 252K tonnes, growing by +2.9% against the previous year. In value terms, rare earth metal production fell to $10.6B in 2020 estimated at export prices.

China (140K tonnes) remains the largest rare earth metal producing country worldwide, accounting for 55% of total volume. Moreover, rare earth metal production in China exceeded the figures recorded by the second-largest producer, Australia (38K tonnes), fourfold. Myanmar (30K tonnes) ranked third in terms of total production with a 12% share.

In 2020, the average annual rate of growth in terms of volume in China stood at +6.1%. The remaining producing countries recorded the following average annual rates of production growth: Australia (-6.5% per year) and Myanmar (+20.0% per year).

Global Rare Earth Metal Imports

In 2020, the amount of rare earth metals imported worldwide shrank to 12K tonnes, waning by -14.1% compared with the previous year’s figure. In value terms, rare earth metal imports reduced sharply to $286M (IndexBox estimates) in 2020.

Japan dominates rare earth metal import structure, amounting to 6.8K tonnes, which was approx. 59% of total imports in 2020. Viet Nam (839 tonnes) held the second position in the ranking, followed by Austria (729 tonnes) and Norway (559 tonnes). All these countries together held approx. 18% share of total imports. Thailand (513 tonnes), India (423 tonnes), the U.S. (301 tonnes), Spain (217 tonnes) and Germany (195 tonnes) followed a long way behind the leaders.

In value terms, Japan ($202M) constitutes the largest market for imported rare earth metals worldwide, comprising 70% of global imports. The second position in the ranking was occupied by Thailand ($22M), with a 7.7% share of global imports. It was followed by Viet Nam, with a 4.4% share.

The average rare earth metal import price stood at $24,706 per tonne in 2020, shrinking by -3.7% against the previous year. In 2020, the most notable rate of growth in terms of prices was attained by the U.S., while the other global leaders experienced more modest paces of growth.

Source: IndexBox Platform

wind energy production

U.S. States Producing the Most Wind Energy

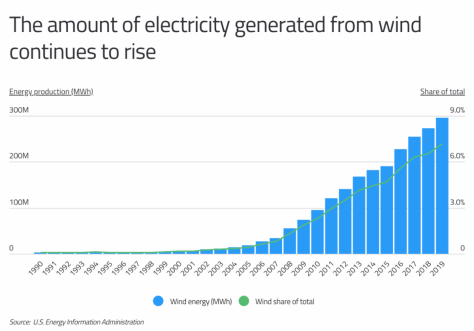
“Meteoric” is one way to describe wind energy’s rise to the top of America’s renewable energy industry.

Amid repeated calls from scientists and activists to undertake measures to curb global warming, lawmakers, politicians, and the energy industry have responded. Foremost in that effort is the call for carbon-free energy production via alternative energy sources like wind and solar. Many states have followed suit, with governors from coast to coast implementing wide-ranging initiatives meant to gradually reduce the carbon footprint of power generation in the coming years.

Wind generation is at the leading edge of the movement toward clean energy production. Fields of wind turbines across the country have slowly started to increase their proportion of total energy production. And just this year, President Joe Biden announced measures meant to accelerate the development of offshore wind energy.

While U.S. offshore wind production currently lags behind that of other developed nations, its onshore capacity is second only to China. Wind energy’s share of total utility-scale electricity generation in the U.S. grew from less than 1% in 1990 to about 8% last year.

In 2019, more than $13 billion was invested in wind power, and the amount of new generation capacity added to the nation’s electrical grids through wind projects was greater than all other sources except natural gas. Driving the investment may be the simple fact that it’s far cheaper to install wind farms than it is to build hydroelectric plants and solar farms. Alongside the value, the federal government subsidized wind construction with tax credits. The result? Wind generation exceeded hydroelectric power for the first time in 2019.

While tax credits and reasonable construction costs have increased wind’s popularity, perhaps its greatest advantage is availability. Wind regularly barrels across the Midwest and the Texas-Oklahoma border at average speeds of 20 to 30 miles per hour, a key speed range, as turbines reach their rated generation capacity when winds hit 26 to 30 miles per hour.

This explains why the Midwest and the West South Central region are home to the top wind-generated electricity producers in the nation. Texas leads the nation in total wind energy production, generating more than twice as much wind electricity as the next state. And while the Lone Star State’s wind energy makes up a significant portion of its renewable energy generation (92%), Kansas’ renewable energy generation relies on wind more than any other state. Kansas’ wind turbines produce more than 99% of its renewable energy and 42% of total.

The data used in this analysis is from the U.S. Energy Information Administration. To determine the states producing the most wind energy, researchers at Commodity.com calculated each state’s annual wind energy production, measured in megawatt-hours. Researchers also calculated the absolute change in wind energy production since 2010, wind’s share of total energy production, and wind’s share of total renewable energy production.

Here are the states producing the most wind energy.

State Rank Annual wind energy production (MWh) Change in wind energy production since 2010 (MWh) Wind share of total energy production Wind share of total renewable energy production


Texas     1     83,620,371 57,368,961 17.3% 92.0%
Oklahoma     2     29,008,131 25,200,048 34.0% 87.2%
Iowa     3     26,304,990 17,134,653 42.0% 96.2%
Kansas     4     21,123,539 17,718,474 41.5% 99.6%
Illinois     5     14,459,597 10,005,963 7.8% 96.0%
California     6     13,735,069 7,656,437 6.8% 14.1%
North Dakota     7     11,213,025 7,117,384 27.3% 77.9%
Minnesota     8     10,964,869     6,173,146 18.5% 75.8%
Colorado     9     10,852,376     7,400,525 19.3% 77.3%
Nebraska     10     7,211,092     6,789,447 19.3% 83.2%
New Mexico     11     6,892,087     5,059,905 19.6% 81.1%
Washington     12     6,677,261     1,932,582 6.3% 9.0%
Oregon     13     6,568,889     2,648,882 10.6% 17.0%
Indiana     14     6,216,030     3,281,987 6.1% 85.7%
Michigan     15     5,825,705     5,465,365 5.0% 58.7%
United States     –     295,882,483     201,230,237 7.2% 40.6%


For more information, a detailed methodology, and complete results, you can find the original report on Commodity.com’s website: https://commodity.com/blog/states-wind-energy/

chemical

China Boosts Imports of Chemical Wood Pulp to Meet Growing Demand for Paper Packaging

IndexBox has just published a new report: ‘China – Chemical Wood Pulp – Market Analysis, Forecast, Size, Trends and Insights’. Here is a summary of the report’s key findings.

In 2020, China increased its chemical wood pulp imports by +10% y-o-y to 24M tonnes. It was driven by rising demand for paper packaging and tableware amid the pandemic and further stimulated by a sharp fall in import prices last year. Brazil, Indonesia and Canada are the major suppliers, providing 57% of the total import volume. Bleached sulphate pulp accounted for 95% of total wood pulp imports into China

Chemical Wood Pulp Imports into China by Country

Chemical wood pulp imports into China amounted to 24M tonnes in 2020, growing by +10% against the previous year’s figure.  A sharp fall in pulp prices last year also encouraged importers to increase purchases. In value terms, chemical wood pulp imports fell by -9.5% to $12B in 2020 (IndexBox estimates).

In 2020, Brazil (7.2M tonnes) constituted the largest chemical wood pulp supplier to China, with a 30% share of total imports. Moreover, chemical wood pulp imports from Brazil exceeded the figures recorded by the second-largest supplier, Indonesia (3.5M tonnes), twofold. The third position in this ranking was occupied by Canada (2.9M tonnes), with a 12% share.

In 2020, the highest increases in terms of chemical wood pulp volume supplied to China were registered in Indonesia (+25.2% y-o-y), Brazil totalled (+14.6% y-o-y) and Russia (+10.2% y-o-y). By contrast, Canada reduced its export volume to China by -3.6% y-o-y.

In value terms, Brazil ($3.3B) constituted the largest supplier of chemical wood pulp to China, comprising 28% of total imports. The second position in the ranking was occupied by Canada ($1.6B), with a 14% share of total imports. It was followed by Indonesia, with a 13% share.

The average chemical wood pulp import price stood at $507 per tonne in 2020, falling by -17.8% against the previous year. A drop in demand for chemical wood pulp from printing and writing paper mills became the main reason for the price reduction.

Average prices varied somewhat amongst the major supplying countries. In 2020, the countries with the highest prices were the U.S. ($582 per tonne) and Canada ($569 per tonne), while the prices for the product from Indonesia ($448 per tonne) and Brazil ($467 per tonne) were amongst the lowest.

Chemical Wood Pulp Imports by Type

In 2020, bleached sulphate pulp (23M tonnes) was the main type of chemical wood pulp supplied to China, with a 95% share of total imports. Moreover, bleached sulphate pulp exceeded the figures recorded for the second-largest type, unbleached sulphate pulp (1.1M tonnes), more than tenfold.

In value terms, bleached sulphate pulp ($11.4B) constituted the largest type of chemical wood pulp supplied to China, comprising 95% of total imports. The second position in the ranking was occupied by unbleached sulphate pulp ($560M), with a 4.7% share of total imports.

Source: IndexBox Platform

canadian

A Founder’s Guide to Importing with Canadian Fulfillment

Since the year 2010 when it overtook the United States, it is no longer news that China has become the world’s leading nation in terms of manufacturing. The United Nations Statistics Division (UNSD) released data that estimated China’s contribution to global manufacturing in 2019 at a massive 28.7 percent. This has turned the attention of many ambitious entrepreneurs to the East where the most populous nation on earth presents itself as an irresistible manufacturing market.

On the other hand, the trade war between the US and China – which has seen both parties slap heavy tariffs on each other’s goods has made it economically difficult to import goods directly from China, and by extension frustrating the efforts of American businesses that are trying to explore the Chinese market.

So, how can the American entrepreneurs that want to take advantage of the booming Chinese market beat the harsh economic demands of direct importation from China? The answer is in taking Canada as a smart China-to-US route and leveraging Section 321 and Canadian Fulfillment.

What is Section 321 and how does it work?

Section 321 is one of the most common US Customs and Border Protection (CBP) statutes known by ecommerce businesses. Introduced in 2019, the section authorizes low-value merchandise below the minimum of $800 to be exempted from paying custom duties or taxes.

What does Canadian fulfillment mean?

Canadian fulfillment companies are third-party companies in Canada that receive and provide warehousing and logistic services, as well as handle the shipping processes, checking in imported stock for business organizations, and helping them to deliver orders directly to their customers. Their delivery service makes sure the processing and shipping of orders to the US are carried out on the same day just as would be the case from a store in the States.

How do you take full advantage of Section 321 through Canadian fulfillment?

As mentioned above, Section 321 is a bridge for direct importation from China to the US. It is important to note, however, Section 321 alone, is not enough. There are certain conditions and best practices that could make the process tedious and difficult for business owners to ship their goods through the border. These conditions, if not complied with, may also lead to serious punishments and delays in shipment.

Here is how you as an entrepreneur that has an ecommerce business can take advantage of Canadian fulfillment, maximize the benefits of section 321 and bypass its constraints:

1. Importers are only allowed to claim Section 321 once daily. If you are going to be importing goods that are worth above the $800 value threshold (which is very likely), this means you will not be able to ship your entire goods through the US border all at once. As an entrepreneur, using the services of a Canadian fulfillment company will aid in maintaining business-to-customer and business-to-business delivery operations across the border at an economy-friendly cost, and without having to worry about the import duty and tax.

2. Apart from the daily limit, the logistic effort of receiving very large ecommerce shipments from China, shipping them to the U.S., and the cost of transporting them to your warehouse could be very overwhelming and unnecessary. E-commerce business owners have settled with using the warehousing services of Canadian fulfillment to save cost and prevent stress.

3. An entrepreneur that does not have to worry about the logistic and warehousing aspect of their business would have the opportunity of focusing on other things.

Summarily, leveraging on Section 321 through Canadian fulfillment can help entrepreneurs conveniently maximize their exploits in the Chinese market without feeling the economic heat of the trade war.

chestnut

China Dominates the Global Chestnut Market While European Countries Increase Imports Gradually

IndexBox has just published a new report: ‘World – Chestnut – Market Analysis, Forecast, Size, Trends and Insights’. Here is a summary of the report’s key findings.

China remains an unrivaled leader in global chestnut consumption with a share of 81% of the total market. Chestnuts are widely used there in cooking, roasted with sugar, or for processing. The vast majority of chestnuts in China are produced domestically. Italy acts as the major importer of chestnuts worldwide, while Turkey, Portugal and France feature the highest pace of import growth. 

Consumption by Country

China (1.9M tonnes) remains the largest chestnut-consuming country worldwide, accounting for 81% of total volume. The majority of chestnuts in the country are sourced domestically – China also features as a top global chestnut producer. The volume of consumption in China exceeded the figures recorded by the second-largest consumer, Bolivia (89K tonnes), more than tenfold. The third position in this ranking was occupied by Turkey (61K tonnes), with a 2.7% share.

In China, chestnut consumption expanded at an average annual rate of +1.2% over the period from 2012-2020. In the other countries, the average annual rates were as follows: Bolivia (+5.2% per year) and Turkey (+1.9% per year).

In value terms, China ($4B) led the market, alone. The second position in the ranking was occupied by Bolivia ($259M). It was followed by Turkey.

Imports by Country

In 2020, the volume of chestnuts imported worldwide dropped to 93K tonnes, with a decrease of -13.9% against the previous year. In value terms, chestnut imports contracted to $250M (IndexBox estimates) in 2020.

Italy was the largest importing country with an import of about 24K tonnes, which resulted at 26% of total imports. France (7.7K tonnes) occupied an 8.3% share (based on tonnes) of total imports, which put it in second place, followed by Switzerland (5.9%) and Thailand (5.1%). Taiwan (Chinese) (3.8K tonnes), China (3.5K tonnes), Germany (3.5K tonnes), Turkey (3.2K tonnes), Spain (3K tonnes), the U.S. (2.8K tonnes), South Korea (2.6K tonnes), Austria (2.4K tonnes) and Portugal (2.2K tonnes) held a minor share of total imports.

Imports into Italy increased at an average annual rate of +4.1% from 2012 to 2020. At the same time, Turkey (+44.8%), Portugal (+7.8%), France (+6.4%), Germany (+4.5%), South Korea (+3.3%), Spain (+2.6%) and Taiwan (Chinese) (+1.3%) displayed positive paces of growth.

In value terms, Italy ($64M) constitutes the largest market for imported chestnuts worldwide, comprising 26% of global imports. The second position in the ranking was occupied by Germany ($18M), with a 7.1% share of global imports. It was followed by Switzerland, with a 6.3% share.

Source: IndexBox Platform

Fire Protection Systems

Fire Protection Systems Market Revenue to Observe 5.5% Gains to 2027

Recent trends in the global fire protection systems market are driven by an upsurge in product launches by major fire safety equipment suppliers.

For instance, in October 2020, Honeywell rolled out the first tools from its new suite of CLSS (Connected Life Safety Services), the company’s first all-in-one cloud platform for fire protection systems. The organization’s CLSS line of tools, developed on the Honeywell Forge platform, allows fire technicians to provide compliance, minimize disruption, and decrease the time required for installation, design, maintenance, commissioning, and reporting of life safety systems.

According to Sameer Agrawal, Honeywell’s General Manager of Global Fire Software and Services, today’s global environment requires the life and fire safety industry to innovate solutions that allow system integrators and facility managers to diagnose issues and monitor their systems irrespective of the time and location.

Similar advancements are expected to boost the demand for fire protection equipment through the forthcoming years. On this note, the global fire protection systems market size is estimated to surpass USD 70 billion by 2027, cites the latest research by Global Market Insights, Inc.

This growth is attributed to the rising product demand in light of the surging number of fire accidents due to the lack of fire protection systems at heritage sites.

For exemplar, in 2019, the NCHA (National Cultural Heritage Administration) reported almost six fire accidents at heritage sites and buildings. For overcoming like issues, the Chinese government has started the deployment of fire protection systems as prevention measures.

Some major trends driving fire protection systems industry outlook comprise:

Increasing industrialization and urbanization in the APAC

The Asia Pacific fire protection systems market is set to exhibit an appreciable CAGR through 2027, considering the rising urbanization and industrialization in the region.

Various countries comprising India, Japan, and China are focusing on the implementation of numerous building guidelines and codes for the fire safety of structures, bolstering the demand for fire protection equipment in the region.

Rising corporate strategies by major industry participants

Prominent players in the fire protection systems market include Schneider Electric, Johnson Controls International PLC, Siemens AG, Fire Suppression Limited, Napco Security Technologies, Hochiki Corporation, Schrack Seconet AG, and others.

These fire safety equipment suppliers are focusing on various collaborative strategies such as acquisitions and mergers for the expansion of their geographical footprint.

For instance, in June 2018, Johnson Controls rolled out its fire protection system, Autocall, in the Middle East for its application in large as well as small projects in industries comprising oil & gas and chemical.

Surging product usage across the residential sector

An escalation in the loss of life and property damage on account of the rising residential fire accidents is slated to foster the growth of the residential segment in the fire protection systems industry through the ensuing years.

Furthermore, a rise in the demand for construction activities due to an increase in population is expected to boost the deployment of fire protection systems in buildings.

In a nutshell, surging government standards and regulations for the improvement of the safety of individuals and industrial, commercial and residential property during fire outbreaks will augment fire protection systems market share over the assessment period.

Source: Global Market Insights, Inc.

apple

China Ramps Up Supplies and Drives Out Competitors from the Philippine Apple Market

IndexBox has just published a new report: ‘China – Apple – Market Analysis, Forecast, Size, Trends and Insights’. Here is a summary of the report’s key findings.

In 2020, apple exports from China increased by 22% to 1.2M tonnes, thanks to the shipments to the Philippines have doubled. China’s share in the Philippine apple imports reached 92.1%. Apart from the Philippines, the main export destinations for China were Myanmar, Bangladesh, Thailand, Vietnam, Indonesia, Malaysia, Nepal, Hong Kong (SAR) and Singapore.

Apple Exports from China

In 2020, after two years of decline, there was significant growth in shipments abroad of apples, when their volume increased by 22% to 1.2M tonnes. Over the period under review, total exports indicated a tangible increase from 2012 to 2020: its volume increased at an average annual rate of +4.7% over the last eight-year period. In value terms, apple exports skyrocketed to $1.4B in 2020. Overall, exports enjoyed a prominent expansion.

Myanmar (183K tonnes), Bangladesh (179K tonnes) and the Philippines (168K tonnes) were the main destinations of apple exports from China, with a combined 45% share of total exports. These countries were followed by Viet Nam, Thailand, Indonesia and Nepal, which together accounted for a further 40%.

2020 saw a twofold increase in apple supplies from China to the Philippines. China gained its share in the Philippine apple market to reach 92.1% and was followed by the U.S. (4.1%) and New Zealand (3.1%).

From 2012 to 2020, the most notable growth rate in terms of shipments, amongst the main countries of destination, was attained by Viet Nam, while exports for the other leaders experienced more modest paces of growth.

In value terms, the largest markets for apple exported from China were Viet Nam ($322M), the Philippines ($213M) and Thailand ($213M), together accounting for 52% of total exports.

The average apple export price stood at $1,220 per tonne in 2020, waning by -4.9% against the previous year. In general, export price indicated a strong increase from 2012 to 2020: its price increased at an average annual rate of +5.0% over the last eight years. From 2012 to 2020, the most notable rate of growth in terms of prices was recorded for supplies to Viet Nam, while the prices for the other major destinations experienced more modest paces of growth.

Source: IndexBox Platform

egg

Global Chicken Egg Market Is Soaring Despite the Pandemic

IndexBox has just published a new report: ‘World – Hen Eggs – Market Analysis, Forecast, Size, Trends and Insights’. Here is a summary of the report’s key findings.

The global chicken egg market continues to expand and is forecast to reach 138M tonnes by 2030 thanks to an increase in demand, driven by population growth. During the pandemic, sales to the HoReCa sector crashed, however, this was offset by heightened demand from the retail market. With a 50% global market share, China remains the absolute leader in egg consumption. The diminishing use of preventative antibiotics within livestock emerges as a market trend. This potentially causes the safer form of medication, immunotherapy, to become an attractive sector for investments.

Key Trends and Insights

The size of the global chicken egg market continues to climb due to heightened demand from growing populations, particularly in Asia, Eastern Europe, the Middle East and Northern Africa. According to IndexBox, global production in 2020 surpassed 2019 levels by 2.7%, reaching 116M tonnes. Another factor strengthening consumption could be the use of eggs in the production of flu and COVID vaccines. These aspects are expected to continue impacting the demand in the midterm and heading into 2030, the global chicken egg market will reach 138M tonnes (IndexBox estimates).

In the global consumption of chicken eggs, China has a massive lead over all other countries. At 58.6M tonnes in 2020, Chinese consumption was almost 9 times higher than the US, which ranked second in production and consumption. China also is the first in the world for per capita consumption (40kg per year per person).

Demand for eggs in the HoReCa segment worldwide fell sharply during the pandemic. Producers quickly adapted to the changing conditions and diverted deliveries away from the foodservice industry and toward the retail sector to meet the rapidly growing demand from households. Another option is to offer pre-boiled and otherwise prepared eggs to those consumers who work remotely and thus cook and eat at home.

In the past few years, the use of antibiotics has been diminishing because of concerns that target bacteria will develop a resistance to them. The World Health Organization called on producers to cease using preventative medicines and strictly limit the use of specific antibiotics. Besides that, consumer behavior has changed with heightened attention to healthy eating habits, and in response, the use of antibiotics has been unwelcome. Immunotherapies are more and more often used in livestock and could potentially become a safer alternative to antibiotics. In the long-run, this trend could make immunotherapies an attractive sector for investment.

Bird infection outbreaks constitute the main hindrance for the market, as it leads to supply cuts and losses for producers. In the long-term, climate change and global warming will also negatively affect the market because warmer weather conditions decrease chickens’ egg production abilities and increase their susceptibility to disease.

Egg Production by Country

For the ninth consecutive year, the global market recorded growth in the production of chicken eggs, which increased by 2.7% to 116M tonnes in 2020. The total output volume increased at an average annual rate of +2.9% from 2012 to 2020. In value terms, chicken egg production stood at $291.4B in 2020 estimated in export prices.

The country with the largest volume of chicken egg production was China (59M tonnes), comprising approx. 51% of total volume. Moreover, chicken egg production in China exceeded the figures recorded by the second-largest producer, the U.S. (6.8M tonnes), ninefold. India (6.1M tonnes) ranked third in terms of total production with a 5.3% share.

In China, chicken egg production increased at an average annual rate of +2.4% over the period from 2012-2020. In the other countries, the average annual rates were as follows: the U.S. (+1.8% per year) and India (+5.8% per year).

Egg Exports by Country

In 2020, approx. 2M tonnes of chicken eggs were exported worldwide; approximately mirroring 2019 figures. In value terms, chicken egg exports shrank modestly to $3.5B in 2020.

In 2020, the Netherlands (409K tonnes), Turkey (281K tonnes), Poland (196K tonnes), the U.S. (145K tonnes), Germany (109K tonnes), Ukraine (107K tonnes), Spain (92K tonnes), Belgium (87K tonnes), China (75K tonnes) and Malaysia (74K tonnes) represented the major exporter of chicken eggs in the world, creating 78% of total export. The following exporters – Belarus (44K tonnes) and Russia (39K tonnes) – each amounted to a 4.1% share of total exports.

In value terms, the largest chicken egg supplying countries worldwide were the Netherlands ($734M), the U.S. ($427M) and Turkey ($298M), with a combined 42% share of global exports. These countries were followed by Poland, Germany, Belgium, Spain, Malaysia, China, Ukraine, Russia and Belarus, which together accounted for a further 36%.

The average chicken egg export price stood at $1,725 per tonne in 2020, stabilizing at the previous year’s level. Over the period under review, export price indicated a pronounced expansion from 2007 to 2020: its price increased at an average annual rate of +4.1% over the last thirteen-year period. Prices varied noticeably by the country of origin; the country with the highest price was the U.S. ($2,945 per tonne), while Belarus ($727 per tonne) was amongst the lowest.

Source: IndexBox AI Platform

soybean

Soybean Production in the U.S. and Brazil to Expand Robustly Driven by Rising Demand from China

IndexBox has just published a new report: ‘World – Soya Beans – Market Analysis, Forecast, Size, Trends and Insights’. Here is a summary of the report’s key findings.

The currently increasing demand for soybeans in biofuel production, animal feed and food products outpaced production growth, resulting in a significant hike in soya prices. Together with expectations of further price growth, it contributes to rising costs of many downstream products and accelerates food inflation. In China,  rebuilding pig herds after swine fever outbreaks emerges as a new driver for the global market. Those factors highlight soybeans as an attractive commodity to invest in, leading to robust expansion of crop acreage in the U.S. and Brazil. 

Key Trends and Insights

Global soybean consumption increased steadily over 2020-2021, while soybean stocks worldwide have seen rapid depletion. The escalating demand in China, which accounts for 60% of the growth in the soybean trade worldwide, is currently the key driving force of the global soybean market. China is significantly rebuilding its livestock population following outbreaks of African swine fever, and the demand for soybean has surged, as soya is a key additive ingredient to livestock feed.

The expected recovery in demand for biofuel as the global economy emerges from the pandemic also shapes further expansion of the raw soybean market. The high soybean prices may yet curb the biofuel market’s growth rate, removing the soybean fuel as a viable competitor in terms of conventional types of fuel.

The fear that the demand for soybeans will soon exceed supply, combined with the rising production costs, contributes to prices increases. The average soybean price (Rotterdam CIF, US origin) in 2020 stood at $380 per tonne; then, in the first half of 2021, prices soared to $544 per tonne. This hike should lead to higher prices for meat, animal feed and biofuel.

The high prices for animal proteins are further enhancing the development of the market for alternative soybean foods. In 2020, global investment into the alternative protein industry saw a twofold increase against the previous year. China is forecast to record the most significant rise in the consumption of soybean meal in animal feed, and soybean-derived protein concentrates for general food products.

The promising outlook for the soybean market is attracting investment in a bid to expand potential crop acreage. In 2021, global soybean production is set to increase by 23М tonnes to reach 386М tonnes due to the increase in the land being harnessed for crop production in the U.S. and South America, particularly Brazil. Market performance is forecast to retain its current trend pattern, expanding with an anticipated CAGR of +3.3% from 2020 to 2030, which is projected to bring the market volume to 489M tonnes by the end of 2030 (IndexBox estimates).

Soybean Consumption by Country

The global soybean market value fell slightly to $150.9B in 2020, stabilizing at the previous year’s level. This figure reflects the total revenues of producers and importers (excluding logistics costs, retail marketing costs, and retailers’ margins, which will be included in the final consumer price).

China (132M tonnes) constituted the country with the largest volume of soybean consumption, comprising approx. 37% of total volume. Moreover, soybean consumption in China exceeded the figures recorded by the second-largest consumer, Argentina (48M tonnes), threefold. Brazil (46M tonnes) ranked third in terms of total consumption with a 13% share.

In China, soybean consumption expanded at an average annual rate of +5.8% over 2012-2020. The remaining consuming countries recorded the following average annual rates of consumption growth: Argentina (+4.4% per year) and Brazil (+4.0% per year).

In value terms, China ($54B) led the market alone. The second position in the ranking was occupied by Argentina ($19.9B). It was followed by Brazil.

In 2020, the highest levels of soybean per capita consumption were registered in Argentina (1,059 kg per person), followed by Brazil (214 kg per person), the U.S. (105 kg per person) and China (90 kg per person), while the world average per capita consumption was estimated at 45 kg per person.

Soybean Exports by Country

Brazil (75M tonnes) and the U.S. (65M tonnes) prevails in soybean exports, together constituting 85% of the total volume. It was distantly followed by Argentina (7.7M tonnes), making up a 4.7% share of total exports. The following exporters – Paraguay (5M tonnes) and Canada (4.4M tonnes) – each finished a 5.8% share of total exports.

From 2012 to 2020, the most notable growth rate in terms of shipments amongst the key exporting countries was attained by Brazil, while exports for the other global leaders experienced more modest paces of growth.

In value terms, Brazil ($29B), the U.S. ($25.9B) and Argentina ($3.1B) were the countries with the highest levels of exports in 2020, together accounting for 90% of global exports.

The average soybean export price stood at $395 per tonne in 2020, approximately mirroring the previous year. Average prices varied somewhat amongst the major exporting countries. In 2020, major exporting countries recorded the following prices: in Canada ($437 per tonne) and Argentina ($407 per tonne), while Paraguay ($323 per tonne) and Brazil ($387 per tonne) were amongst the lowest.

Source: IndexBox AI Platform

biodiesel

The Global Biodiesel Market Retains Robust Growth Despite the Pandemic and Low Oil Prices

IndexBox has just published a new report: ‘World – Biodiesel – Market Analysis, Forecast, Size, Trends And Insights’. Here is a summary of the report’s key findings.

Neither the pandemic nor the low oil prices succeeded in slowing the growth of the global biodiesel market. As economies worldwide start to recover from the Covid crisis, and environmental concerns increase, the demand is set to remain robust in 2021. 

Key Trends and Insights

In 2020, the demand for biodiesel declined to 39.5M tonnes after five years of solid growth, largely a result of reduced transport activity during the pandemic. In 2021, global biodiesel consumption started to recover robustly. Despite the low prices for conventional types of fuel, the global energy market is striving to adhere to the Paris Agreement by reducing greenhouse gas emissions and making a shift towards using sustainable forms of energy, which is to promote the use of biofuels.

The European market became especially attractive for Asian exporters in the first half of 2021: local biofuel producers were forced to cut output against high prices in the EU for vegetable oils. The biofuel shortage in Europe could be offset by supplies of palm oil from Indonesia and Malaysia, but in 2019, the European Union intended to secure the gradual phasing out of palm oil as a viable fuel. This is spurred by the concern regarding tropical rainforests destroyed while expanding palm plantations, which depreciates any positive effect for the environment that could be achieved from the use of biofuel.

In 2021, American biofuel producers initiated a rapid rise in production but faced the risk of a shortage of raw materials. Assuming the demand for biodiesel to increase, the USA plans to see a fivefold increase in biofuel production capacity by 2024.

The global demand for fuels is set to increase along with the recovery of the global economy from the pandemic. Rising environmental concerns worldwide become a new powerful trend transforming the global energy market. Since biodiesel meets the green agenda, it should enjoy accelerated market growth in the medium term. It is forecast that the biodiesel market is set to develop at an average annual rate of +4.9% through to 2030, to approx. 63М tonnes.

Biodiesel Consumption by Country

The countries with the highest volumes of biodiesel consumption in 2020 were Indonesia (6.2M tonnes), the U.S. (5.6M tonnes) and Brazil (5.4M tonnes), together comprising 44% of global consumption.

In value terms, Brazil ($5.8B), Indonesia ($5B) and the U.S. ($4.7B) constituted the countries with the highest levels of market value in 2020, together accounting for 42% of the global market.

The countries with the highest levels of biodiesel per capita consumption in 2020 were the Netherlands (55 kg per person), France (40 kg per person) and Spain (34 kg per person).

Biodiesel Exports and Imports by Country

In 2020, overseas shipments of biodiesel decreased by -11.8% to 16M tonnes for the first time since 2015, thus ending a four-year rising trend. In value terms, biodiesel exports fell to $15.9B (IndexBox estimates) in 2020.

In 2020, the Netherlands (4.7M tonnes), distantly followed by Germany (2.3M tonnes), Belgium (1.6M tonnes), Spain (1.5M tonnes) and Argentina (0.8M tonnes) were the key exporters of biodiesel, together comprising 66% of total exports. The following exporters – China (665K tonnes), Malaysia (564K tonnes), Bulgaria (494K tonnes), the U.S. (476K tonnes), Canada (397K tonnes), France (397K tonnes), Poland (365K tonnes) and Italy (265K tonnes) – together made up 22% of total exports.

Among the main exporting countries, China (+51.3% per year) saw the highest growth rate of the value of exports, over the period under review, while shipments for the other global leaders experienced more modest paces of growth.

In 2020, after five years of growth, there was a significant decline in supplies from abroad of biodiesel, when their volume decreased by -7.4% to 16M tonnes. In value terms, biodiesel imports contracted modestly to $15.9B in 2020.

In 2020, the Netherlands (3.9M tonnes), distantly followed by Belgium (1.8M tonnes), Germany (1.5M tonnes), Spain (1.2M tonnes), the UK (1.1M tonnes), France (1.1M tonnes), Italy (1.1M tonnes) and China (0.8M tonnes) were the key importers of biodiesel, together making up 77% of total imports. The U.S. (674K tonnes), Canada (518K tonnes), Poland (319K tonnes) and Bulgaria (276K tonnes) took a little share of total imports.

Source: IndexBox AI Platform