New Articles

Propane Council Encourages Ports to Apply for Funding

funding

Propane Council Encourages Ports to Apply for Funding

Grant funding applications are now open for safety, efficiency and reliability improvement projects.

The U.S. Department of Transportation Maritime Administration (MARAD) recently opened applications for the Port Infrastructure Development Program (PIDP). More than $600 million in grant funding is available for projects that include environmental and emissions mitigation measures and terminal equipment upgrades.

Heavy-duty diesel equipment in ports, such as forklifts and yard tractors, are a leading cause of air pollution within nearby communities. With this funding, ports can begin replacing their diesel and gasoline-powered equipment with clean energy alternatives such as propane-powered port tractors, forklifts, and other cargo handling equipment (CHE). In fact, best-in-class propane forklift engines produce 97 percent fewer hydrocarbon and nitrogen oxide (NOx) emissions when compared with similarly sized diesel forklifts without any drop-off in payload or power.

Along with CHE upgrades, propane-powered charging infrastructure, such as mobile charging pods and anti-idling shore power technologies, are also eligible for funding. This is a cost-effective and low-emissions strategy to provide immediate clean energy power for CHE and other mobile equipment. Because propane is affordable, ports can more quickly implement clean solutions to accelerate emissions reductions. 

Propane-powered microgrid projects are also eligible for PIDP grant funding. Microgrids are local, isolated and independent electric grids that can be either grid connected or disconnected. The microgrids produce power with a combination of propane generation equipment and renewable sources like wind and solar. By combining ultra-low emissions propane with renewable energy sources, ports are able to significantly reduce emissions.

Beyond emissions reductions, propane-powered microgrids provide autonomy and resilience that keeps the lights on, assures equipment is charged and assists with making sure containers stay moving in the ports — even when the grid fails.

Qualified projects can be located within the port, outside a port boundary and directly related to port operations, or as an intermodal port connection. Grant applications must be submitted through Grants.gov by 11:59 p.m. EST on April 28, 2023. For grant writing support, reach out to PERC at Propane.com/Contact.

There are many ways propane can help ports improve efficiency and reduce their carbon footprints. To learn more, visit Propane.com/Ports.

Propane Education & Research Council (PERC)

The Propane Education & Research Council is a nonprofit that provides leading propane safety and training programs and invests in research and development of new propane-powered technologies. PERC is operated and funded by the propane industry. For more information, visit Propane.com.

fuel

Propane Now Reducing Emissions Through Recharging Infrastructure

The dual-purpose standalone fueling system from Propane Fueling Solutions provides fleets with reliable solutions whether they refuel with propane autogas or need to recharge using a propane-powered microgrid

After decades of reliably providing fleets with a clean energy solution, propane is now reducing emissions along the path to zero even further by providing a significantly less expensive and cleaner recharging solution. The new portable dual-purpose standalone fueling system from Propane Fueling Solutions allows fleets with various alternative fuel vehicles to refuel with propane autogas or recharge with DC level 3 fast chargers independent of the grid.

The skid infrastructure combines an efficient 60kW propane generator with wind and solar power to create a microgrid that allows fleets to affordably implement a drop-in charging solution. The skid also includes a refueling station for propane autogas vehicles.

For light commercial microgrid (<100kW generation system) applications, propane fuel cells can lead to near-zero nitrogen oxide (NOx) and carbon monoxide (CO) emissions, as well as a 24 percent reduction in carbon dioxide (CO2) emissions. Propane fuel cells are also cost-competitive with diesel generators.

Compared to traditional EV charging infrastructure, the skid solution is significantly less expensive than traditional EV charging infrastructure because it doesn’t require the same site prep, permanent housing, or other costly charges that are incurred with permanent infrastructure. According to Propane Fueling Solutions, the skid cuts costs by as much as 75 percent or more. Because of its affordability, the dual-purpose standalone fueling system allows fleets to try both propane autogas and electric vehicles—and learn about the capabilities and limitations of multiple energy sources—without making costly infrastructure investments.

The dual-purpose standalone fueling system will be on display in PERC’s booth (#353) at the NTEA Work Truck Show, March 7-10, in Indianapolis, Indiana. Attendees who visit the booth can learn more about the ease of refueling or recharging with the infrastructure through guided demonstrations of the new technology.

Propane Education & Research Council (PERC)

The Propane Education & Research Council is a nonprofit that provides leading propane safety and training programs and invests in research and development of new propane-powered technologies. PERC is operated and funded by the propane industry.

consortium urea bakken

Hyosung Makes Strategic Investment in Bakken Energy

South Korean Industrial Leader Supports Bakken Energy’s Hydrogen Initiatives

Bakken Energy, an innovative developer of affordable clean hydrogen at scale, announces Hyosung, a South Korean leader in hydrogen development, has joined Bakken Energy as a strategic investor.

Hyosung has recently become known for advancing technologies related to hydrogen vehicles, such as carbon fiber for fuel tanks and hydrogen charging stations. Hyosung operates in various fields, including the chemical industry, industrial machinery, IT, trade, and construction. Founded in 1966, Hyosung is a large family-owned South Korean industrial conglomerate.

This announcement is the next step towards Bakken Energy advancing its hydrogen mission. Most recently, Bakken Energy announced a partnership with Cummins Inc., and Schneider National Carriers Inc., to work together on the design of the Heartland Hydrogen Hub to serve the needs of long-haul trucking.

About Bakken Energy

Bakken Energy is an innovative clean hydrogen company working to become the largest producer of affordable clean hydrogen in the U.S. Its mission is to decarbonize the hard to decarbonize sectors of the economy with affordable clean hydrogen and to develop the future hydrogen economy that leads toward a low-carbon future.

About Hyosung

Founded in 1966, Hyosung has grown as one of the most prestigious conglomerates in Korea with approximately 20,000 employees and 15 billion dollars in combined group revenues (as of 2021). Hyosung engages in textiles, trading, industrial materials, chemicals, power & industrial systems, construction and information & communication businesses, and operates through more than 100 business sites across 29 countries.

AAL

AAL Carries out Six Month Series of Shipments for the New 181MW Dulacca Wind Farm in Queensland Australia

Between February and July 2022, AAL Shipping (AAL) is operating a series of shipments between several ports in China and Brisbane, Australia, to transport heavy lift and project cargo components for the 181MW Dulacca Wind Farm planned for development in Queensland, Australia – a plant expected to generate enough clean energy to power approximately 124,000 homes in the region.

Employed by multiple global logistics companies to manage the ocean transportation for some of the Wind Farm’s largest components, AAL’s shipments will comprise 43 Vestas wind turbines (towers and blades), transformers, and electrical cables – a total of close to 375,000 freight tons (FRT) of cargo.

Marco Wendt, Chartering Manager, AAL Europe, and spearheading AAL’s global wind cargo movements, revealed AAL has been working closely with Vestas and its appointed logistics partners for a number of years, serving many of its wind farm projects around the world on both a long and short-term employment basis adding that It was a privilege to have this position of trust on such important projects and the successful and safe delivery of customer’s cargo is a key objective for AAL and the teams worldwide.

Andrew Mangan, Chartering Manager, AAL, and coordinating the sailings into Australia from the carrier’s Singapore Headquarters, revealed that the shipments into Brisbane for Dulacca are being loaded from several Chinese ports including Tianjin, Taicang and Yangzhou and they are working with multiple logistics companies in their execution, each with their own specific timeline and cargo requirements. Which led them to therefore decide to utilize two different vessel classes on the project, ‘mega-size’ 31,000 deadweight (DWT) A-Class and the more compact 19,000 DWT S-Class to manage both large and small shipment sizes with as much efficiency and economy of scale for customers as possible.

The 181MW Dulacca Wind Farm is located between Dulacca and Drillham in the Western Downs Region of Queensland and will be powered by 43 Vestas wind turbines of 4.2MW rated capacity each. It will generate enough clean energy to power 124,000 homes and inject over AUD400m into the local economy.

The award of this project is a welcome recognition of AAL’s long-standing ‘Asia – Australia’ trade lane and expertise, which has served customers with a regular scheduled service for over 26 years.

carbon

States With the Least Carbon-Intensive Economies

World leaders convened in Glasgow this November for the 2021 United Nations Climate Change Conference. Facing the intensification of global climate change, the negotiators reached an agreement that explicitly commits to reducing the use of coal, limiting other greenhouse gas emissions, and providing support to developing countries most impacted by climate change.

The Glasgow conference reflected heightened urgency around climate change as the effects of carbon emissions have accelerated and become more severe in recent years. A 2021 report from the Intergovernmental Panel on Climate Change found that without rapid reductions in greenhouse gas emissions, warming above 1.5°C is almost inevitable. This level of warming would have disastrous effects in the form of sea level rise, more severe weather events, and harm to agricultural systems and human health.

While there is still much work to do, the good news for the U.S. is that many states and the country as a whole have begun to reverse the growth in carbon emissions. Government policy to limit emissions and advancements in lower-emission technologies across the economy have helped turn the trends in the right direction.

Much of this progress has taken place over the last fifteen years. Total CO2 emissions peaked in 2007 at over 6 billion metric tons, but that figure fell to around 4.6 billion metric tons in 2020. One of the big contributors has been decarbonization in electric power generation due to the decline of heavy-emitting coal and the rise of clean energy sources like wind and solar. Over the last decade, these factors have reduced CO2 emissions associated with electric power generation by around 36%. And this trend also contributes to emissions reductions in the main “end-use” sectors—transportation, industrial, residential, and commercial—that consume electricity. Residential and commercial have seen the sharpest declines, with emissions dropping by more than a quarter since 2010 across both sectors combined.

Encouragingly, these declines have taken place even while the U.S. population and economy have continued to grow. From 1970 to the mid-2000s, carbon emissions and GDP grew together, with the pace of GDP growth exceeding that of carbon emissions. More recently, the steady upward trajectory of GDP has continued while carbon emissions have ticked downward. Since 2007, total energy-related CO2 emissions are down by 23.9% while real GDP has increased by 17.7% in the same span. These trends help alleviate concerns that reducing carbon emissions necessarily means limiting economic productivity, and many U.S. states are proving that economic growth in a less carbon-intensive economy is possible.

The data used in this analysis is from the U.S. Energy Information Administration and the U.S. Census Bureau. To determine the states with the least carbon-intensive economies, researchers at Commodity.com calculated total CO2 emissions per GDP. States with a lower value were ranked higher. In the event of a tie, the state with lower per capita CO2 emissions was ranked higher.

Here are the states with the least carbon-intensive economies.

State Rank CO2 emissions per GDP (tons per $ million) CO2 emissions per capita Total CO2 emissions (tons) Largest source of CO2 emissions
New York 1 123.6 9.0 175,900,000 Petroleum
Washington 2 135.9 10.2 77,000,000 Petroleum
Connecticut 3 136.8 10.5 37,600,000 Petroleum
California 4 148.0 9.0 356,600,000 Petroleum
Massachusetts 5 158.1 9.4 64,600,000 Petroleum
New Hampshire 6 158.9 10.5 14,300,000 Petroleum
Vermont 7 163.9 9.4 5,900,000 Petroleum
Oregon 8 164.5 9.5 39,900,000 Petroleum
New Jersey 9 198.0 11.9 105,400,000 Petroleum
Maryland 10 200.3 10.2 61,700,000 Petroleum
Rhode Island 11 206.5 10.5 11,100,000 Petroleum, Natural Gas
Hawaii 12 249.7 14.4 20,500,000 Petroleum
Arizona 13 252.1 13.1 93,900,000 Petroleum
Illinois 14 253.0 16.7 212,200,000 Petroleum
Maine 15 254.9 11.0 14,800,000 Petroleum
United States 287.2 16.2 5,297,400,000 Petroleum


For more information, a detailed methodology, and complete results, you can find the original report on Commodity.com’s website: https://commodity.com/blog/states-carbon-emissions/

wind energy production

U.S. States Producing the Most Wind Energy

“Meteoric” is one way to describe wind energy’s rise to the top of America’s renewable energy industry.

Amid repeated calls from scientists and activists to undertake measures to curb global warming, lawmakers, politicians, and the energy industry have responded. Foremost in that effort is the call for carbon-free energy production via alternative energy sources like wind and solar. Many states have followed suit, with governors from coast to coast implementing wide-ranging initiatives meant to gradually reduce the carbon footprint of power generation in the coming years.

Wind generation is at the leading edge of the movement toward clean energy production. Fields of wind turbines across the country have slowly started to increase their proportion of total energy production. And just this year, President Joe Biden announced measures meant to accelerate the development of offshore wind energy.

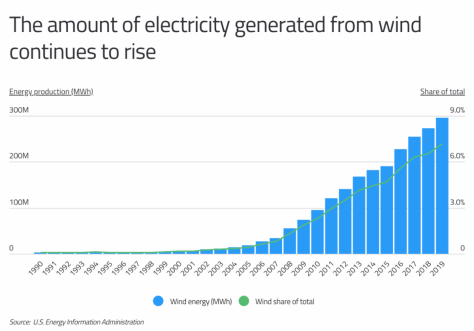
While U.S. offshore wind production currently lags behind that of other developed nations, its onshore capacity is second only to China. Wind energy’s share of total utility-scale electricity generation in the U.S. grew from less than 1% in 1990 to about 8% last year.

In 2019, more than $13 billion was invested in wind power, and the amount of new generation capacity added to the nation’s electrical grids through wind projects was greater than all other sources except natural gas. Driving the investment may be the simple fact that it’s far cheaper to install wind farms than it is to build hydroelectric plants and solar farms. Alongside the value, the federal government subsidized wind construction with tax credits. The result? Wind generation exceeded hydroelectric power for the first time in 2019.

While tax credits and reasonable construction costs have increased wind’s popularity, perhaps its greatest advantage is availability. Wind regularly barrels across the Midwest and the Texas-Oklahoma border at average speeds of 20 to 30 miles per hour, a key speed range, as turbines reach their rated generation capacity when winds hit 26 to 30 miles per hour.

This explains why the Midwest and the West South Central region are home to the top wind-generated electricity producers in the nation. Texas leads the nation in total wind energy production, generating more than twice as much wind electricity as the next state. And while the Lone Star State’s wind energy makes up a significant portion of its renewable energy generation (92%), Kansas’ renewable energy generation relies on wind more than any other state. Kansas’ wind turbines produce more than 99% of its renewable energy and 42% of total.

The data used in this analysis is from the U.S. Energy Information Administration. To determine the states producing the most wind energy, researchers at Commodity.com calculated each state’s annual wind energy production, measured in megawatt-hours. Researchers also calculated the absolute change in wind energy production since 2010, wind’s share of total energy production, and wind’s share of total renewable energy production.

Here are the states producing the most wind energy.

State Rank Annual wind energy production (MWh) Change in wind energy production since 2010 (MWh) Wind share of total energy production Wind share of total renewable energy production


Texas     1     83,620,371 57,368,961 17.3% 92.0%
Oklahoma     2     29,008,131 25,200,048 34.0% 87.2%
Iowa     3     26,304,990 17,134,653 42.0% 96.2%
Kansas     4     21,123,539 17,718,474 41.5% 99.6%
Illinois     5     14,459,597 10,005,963 7.8% 96.0%
California     6     13,735,069 7,656,437 6.8% 14.1%
North Dakota     7     11,213,025 7,117,384 27.3% 77.9%
Minnesota     8     10,964,869     6,173,146 18.5% 75.8%
Colorado     9     10,852,376     7,400,525 19.3% 77.3%
Nebraska     10     7,211,092     6,789,447 19.3% 83.2%
New Mexico     11     6,892,087     5,059,905 19.6% 81.1%
Washington     12     6,677,261     1,932,582 6.3% 9.0%
Oregon     13     6,568,889     2,648,882 10.6% 17.0%
Indiana     14     6,216,030     3,281,987 6.1% 85.7%
Michigan     15     5,825,705     5,465,365 5.0% 58.7%
United States     –     295,882,483     201,230,237 7.2% 40.6%


For more information, a detailed methodology, and complete results, you can find the original report on Commodity.com’s website: https://commodity.com/blog/states-wind-energy/

solar energy

States Producing the Most Solar Energy

In the first few months of his administration, one of President Joe Biden’s top policy priorities has been addressing the threat of climate change—while also improving infrastructure and creating jobs to generate economic growth. Biden has stated a goal of reaching 100% pollution-free electricity by 2035, which means dramatically scaling up renewable energy production in the U.S. To that end, Biden’s proposed American Jobs Plan would include extensive tax credits, grants, and other investments in clean energy.

One of the potential beneficiaries of this focus is the solar power industry, which is seeing rapid growth as the costs associated with solar decline. For many years, solar power was too expensive to be adopted at scale as a major source of energy production, but this has changed in recent years.

One of the biggest reasons for the decline in costs has been technological innovation. Solar technology has become more reliable and more efficient over time, which lowers the cost of generating energy. As those costs decrease, adoption becomes more common, which allows solar cell manufacturers to achieve economies of scale and lower prices even further.

Government support has also been a major factor: billions in federal investment for renewables during the Great Recession helped spur the technological advances seen in the last decade, and the federal government—along with many states and localities—has long offered tax breaks and other incentives to subsidize household solar adoption.

These factors reached an inflection point in the mid-2000s, and solar production in the U.S. has been growing exponentially ever since. In 2006, solar generated around 507,000 megawatt-hours of energy and represented .01% of U.S. energy generated by the electric power industry. By 2019, solar thermal and photovoltaic accounted for 71,936,822 megawatt-hours—around 140 times more than in 2006—to represent 1.74% of the total.

Solar is still a relatively small part of the U.S.’s overall energy mix but will become an increasingly significant source as solar production continues to accelerate—particularly if the Biden Administration’s climate policies and clean energy investments come to pass. For now, however, renewables overall (17.7% of total electricity generation) still lag behind natural gas (38.4%), coal (23.4%), and nuclear (19.6%). Within the renewable category, solar (9.9% of renewable production) trails wind (40.6%) and hydroelectric (39.5%).

Despite its small but growing role in overall U.S. energy production, solar is a major part of the energy mix in a number of states. The undisputed leader of these states is California, which leads all others both by total solar energy production and the share of electricity derived from solar. California’s total solar energy production is nearly four times that of the runner-up state, North Carolina. Many of the market factors that have made solar more popular nationwide hold in California, too, but the Golden State also has geographic features and a political climate that have made it a solar leader.

In terms of geography, California is one of the U.S. states with the highest levels of insolation, or exposure to the sun. Insolation is a factor for many other leading states for solar production, including Sun Belt locations like Texas, Southwestern states Nevada and Arizona, and Southeastern states North Carolina, Georgia, and Florida. Politically, California’s policymakers have created an environment that all but guarantees heavy reliance on solar energy. For instance, California has one of the most ambitious renewable portfolio standards of any U.S. state, with a goal of generating 60% of energy from renewables by 2030 and 100% of energy from renewables by 2045. Additionally, in 2020, the state began requiring most new homes to include rooftop solar panels.

To find the states where solar production is highest, researchers at Commodity.com used data from the U.S. Energy Information Administration’s Electricity Power Data. States were ranked by annual solar production for electric power (in megawatt-hours) for 2019. The researchers also calculated the year-over-year change in total solar energy production from 2018–2019, as well as what percentage of total energy production and renewable energy production solar accounts for.

Here are the states producing the most solar energy.

State


Rank


Annual solar energy production (Megawatt-hours)


Change in solar energy production (YoY)


Solar share of total energy production


Solar share of total renewable energy production


California    1    28,331,513 +5.0% 14.0% 29.1%
North Carolina    2    7,451,338 +21.9% 5.7% 44.6%
Arizona    3    5,278,019 +2.7% 4.6% 43.0%
Nevada    4    4,810,511 +1.9% 12.1% 42.4%
Texas    5    4,365,125 +36.2% 0.9% 4.8%
Florida    6    3,901,445 +61.7% 1.6% 45.6%
Utah    7    2,186,424 -1.7% 5.6% 51.3%
Georgia    8    2,160,770 +8.3% 1.7% 18.8%
New Mexico    9    1,365,900 +1.3% 3.9% 16.1%
Minnesota    10    1,248,833 +19.8% 2.1% 8.6%
Colorado    11    1,218,220 +14.7% 2.2% 8.7%
New Jersey    12    1,164,721 +17.6% 1.6% 57.9%
Massachusetts    13    1,163,776 +19.0% 5.4% 34.7%
Virginia    14    949,111 +24.4% 1.0% 15.3%
South Carolina    15    858,546 +68.2% 0.9% 14.3%
United States    –    71,936,822 +12.7% 1.7% 9.9%


For more information, a detailed methodology, and complete results, you can find the original report on Commodity.com’s website: https://commodity.com/blog/states-solar-energy/

Propane

Does Your Sustainability Plan Include Propane? Here Are 3 Reasons It Should.

Clean Air Month, celebrated in May, brings heightened awareness to an important issue for ports and port communities.

Ports traffic a high number of ships, vessels, barges, and boats on a daily basis and, because many are powered by dirty, high-carbon bunker fuel, air quality issues are a particular concern in and around port communities. As the momentum to reduce emissions and improve air quality continues to grow across the international port industry, many port authorities are seeking cleaner energy alternatives to use on-site.

According to the Environmental Protection Agency (EPA), switching to cleaner fuel is one of the most effective strategies for emissions reduction. That means clean, low-emissions energy sources—like propane—can offer considerable environmental and economic advantages for various port applications.

1. Propane-powered equipment reduces emissions

Diesel engines are the current workhorse of the American economy, and although they can be reliable and efficient, older diesel engines can emit significant amounts of air pollution, including particulate matter, NOx, and carbon dioxide, according to the EPA. And while many port authorities think the solution to lower emissions is to electrify their equipment, they’re likely unaware that propane has a cleaner and more transparent emissions profile when lifecycle emissions are taken into consideration. This includes site-to-source emissions produced in the creation and transmission of electric forklift batteries.

Sometimes data can speak louder than words and the Propane Education & Research Council has valuable data to support the claim that this is the cleanest energy source for port operations. Most notably, using propane produces 43 percent fewer greenhouse gas emissions than using an equivalent amount of electricity generated from the U.S. grid, according to data from PERC. And thanks to propane’s energy versatility, crews can reduce emissions across a port with propane-powered forklifts, port and terminal tractors, light- and medium-duty vehicles, shuttles, power generation, and even small marine vessels.

For smaller material handling needs on-site, propane forklifts reduce emissions compared with their diesel and electric counterparts. Compared with electric, propane can reduce SOx emissions by 76 percent, and compared with diesel forklift engines, propane forklift engines can produce up to 97 percent fewer hydrocarbon and nitrogen oxide (NOx) emissions—without any drop-off in payload or power.

Propane can bring emissions reductions to a port’s vehicle fleet, too. Terminal tractors powered by propane autogas produce 12 percent fewer lifecycle greenhouse gas emissions than gasoline-fueled terminal tractors, according to data from the Argonne National Laboratory. And propane autogas vehicles reduce NOx emissions by up to 36 percent compared to diesel vehicles, greenhouse gas emissions by up to 22 percent compared to gasoline vehicles, and up to 45 percent less particulate matter than electric vehicles throughout the full fuel cycle.

2. Propane is environmentally friendly

When ships come in and out of ports day in and day out, not only do they release harmful emissions into the atmosphere, but they can also have a negative impact on water resources, ecosystems, and marine life. Powering land- and sea-side port equipment with propane can introduce a more environmentally-friendly solution. It is an approved clean alternative fuel under the Clean Air Act. Additionally, the energy source is non-toxic and, if leaked, it vaporizes and dissipates into the air, eliminating contamination to air, land, and water resources. Spilled gasoline or diesel, on the other hand, can quickly contaminate these resources.

3. Propane is only getting cleaner

The energy source itself is seeing innovation and in the near future, more propane will be made from renewable sources. Renewable propane is a byproduct of the renewable diesel and jet fuel production process, which converts plant and vegetable oils, waste greases, and animal fat into energy. Because it’s produced from renewable, raw materials, renewable propane is even cleaner than conventional propane—and far cleaner than other energy sources. And considering its chemical structure and physical properties are the same as traditional propane, renewable propane can be used for all the same applications.

To learn more about the environmental benefits and versatility of propane for port operations, visit Propane.com/Ports.

_______________________________________________________________

Matt McDonald is the director of off-road business development for the Propane Education & Research Council. He can be reached at matt.mcdonald@propane.com.