New Articles

U.S. States With the Largest Aquaculture Industry

Aquaculture

U.S. States With the Largest Aquaculture Industry

With the planet’s population growing and the global market for seafood steadily increasing, natural fish production from the world’s lakes, rivers, and oceans will be insufficient to keep up with demand in the long term. To support global demand, aquaculture is a critical resource for raising seafood efficiently and sustainably.

The USDA defines aquaculture as the farming of aquatic organisms, including fish, crustaceans, mollusks, and more. The farming process includes seeding, stocking, and feeding fish, shellfish, and other aquatic products in a controlled environment. The controlled environment makes aquaculture distinct from wild caught seafood taken from a natural habitat.

Aquaculture in the U.S. represents a $1.5 billion industry annually and helps support 1.7 million jobs in the broader seafood industry, according to estimates from the National Oceanic and Atmospheric Administration. These figures place the U.S. relatively low on a global scale as an aquaculture producer—17th in total aquaculture production—but the U.S. is one of the top consumers of aquaculture imports. More than 90% of seafood in the U.S. comes from outside of the country, and around half of that total comes from farm-raised seafood.

These products in the U.S. that generate the most sales fall in the categories of food fish and mollusks. Food fish—a category that includes any fish raised primarily for food, such as catfish, sturgeon, tilapia, trout, or salmon—accounts for nearly half of the market by itself, with $716 million in sales each year. Mollusks—which are marine invertebrates like clams, mussels, and oysters also commonly raised as food—follow behind at $442 million sold each year.

Naturally, a successful aquaculture industry depends on access to geographic features that support production. This means that some regions of the U.S. are more conducive to aquaculture than others. The South leads the U.S. in production, with nearly $850 million in annual sales from aquaculture. This can be attributed to strong production of freshwater fish, especially catfish, in the areas around the Mississippi River watershed, and saltwater production in the Gulf of Mexico and Atlantic Ocean. The West produces $475 million in aquaculture sales each year, primarily from Washington and California, which are leaders in shellfish production but also have strong saltwater and freshwater production of fish like trout, tilapia, and salmon.

The data used in this analysis is from the USDA’s Census of Aquaculture. To identify the states with the most aquaculture production, researchers at Commodity.com ranked states based on the total value of aquaculture products sold. Aquaculture products include food fish, sport fish, baitfish, and ornamental fish, as well as mollusks, crustaceans, and other miscellaneous aquaculture products. The total acreage by state reported in this study is the sum of freshwater and saltwater production (where available), and the most common water source is the water source characteristic of the greatest number of farms in each state.

Here are the states with the largest aquaculture industry.

State

Rank

   Total value of products sold

Total number of aquaculture farms

Total acres

Most common water source

Mississippi    1    $215,709,000 176 39,561 Groundwater
Washington    2    $207,685,000 151 16,263 Saltwater
Louisiana    3    $135,712,000 525 240,274 Groundwater
Virginia    4    $112,640,000 202 17,797 Saltwater
California    5    $106,021,000 116 11,329 Groundwater
Alabama    6    $95,199,000 120 17,591 On-farm surface water
Hawaii    7    $78,429,000 49 794 Saltwater
Maine    8    $72,340,000 75 1,295 Saltwater
Florida    9    $71,649,000 334 3,410 Saltwater
Arkansas    10    $67,661,000 82 29,936 Groundwater
Texas    11    $62,594,000 107 7,566 Groundwater
Idaho    12    $44,763,000 41 498 On-farm surface water
Massachusetts    13    $28,858,000 180 1,046 Saltwater
Maryland    14    $28,139,000 43 2,318 Saltwater
North Carolina    15    $26,006,000 137 2,909 Groundwater
United States    –    $1,515,680,000 3,456 484,000 Groundwater


For more information, a detailed methodology, and complete results, you can find the original report on Commodity.com’s website: https://commodity.com/blog/aquaculture-production/

wind energy production

U.S. States Producing the Most Wind Energy

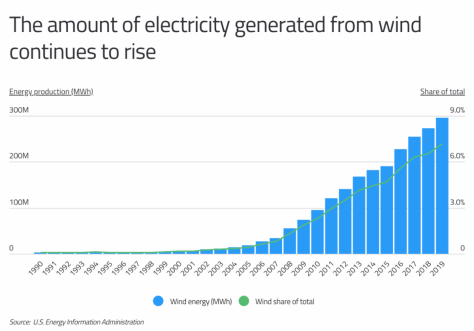
“Meteoric” is one way to describe wind energy’s rise to the top of America’s renewable energy industry.

Amid repeated calls from scientists and activists to undertake measures to curb global warming, lawmakers, politicians, and the energy industry have responded. Foremost in that effort is the call for carbon-free energy production via alternative energy sources like wind and solar. Many states have followed suit, with governors from coast to coast implementing wide-ranging initiatives meant to gradually reduce the carbon footprint of power generation in the coming years.

Wind generation is at the leading edge of the movement toward clean energy production. Fields of wind turbines across the country have slowly started to increase their proportion of total energy production. And just this year, President Joe Biden announced measures meant to accelerate the development of offshore wind energy.

While U.S. offshore wind production currently lags behind that of other developed nations, its onshore capacity is second only to China. Wind energy’s share of total utility-scale electricity generation in the U.S. grew from less than 1% in 1990 to about 8% last year.

In 2019, more than $13 billion was invested in wind power, and the amount of new generation capacity added to the nation’s electrical grids through wind projects was greater than all other sources except natural gas. Driving the investment may be the simple fact that it’s far cheaper to install wind farms than it is to build hydroelectric plants and solar farms. Alongside the value, the federal government subsidized wind construction with tax credits. The result? Wind generation exceeded hydroelectric power for the first time in 2019.

While tax credits and reasonable construction costs have increased wind’s popularity, perhaps its greatest advantage is availability. Wind regularly barrels across the Midwest and the Texas-Oklahoma border at average speeds of 20 to 30 miles per hour, a key speed range, as turbines reach their rated generation capacity when winds hit 26 to 30 miles per hour.

This explains why the Midwest and the West South Central region are home to the top wind-generated electricity producers in the nation. Texas leads the nation in total wind energy production, generating more than twice as much wind electricity as the next state. And while the Lone Star State’s wind energy makes up a significant portion of its renewable energy generation (92%), Kansas’ renewable energy generation relies on wind more than any other state. Kansas’ wind turbines produce more than 99% of its renewable energy and 42% of total.

The data used in this analysis is from the U.S. Energy Information Administration. To determine the states producing the most wind energy, researchers at Commodity.com calculated each state’s annual wind energy production, measured in megawatt-hours. Researchers also calculated the absolute change in wind energy production since 2010, wind’s share of total energy production, and wind’s share of total renewable energy production.

Here are the states producing the most wind energy.

State Rank Annual wind energy production (MWh) Change in wind energy production since 2010 (MWh) Wind share of total energy production Wind share of total renewable energy production


Texas     1     83,620,371 57,368,961 17.3% 92.0%
Oklahoma     2     29,008,131 25,200,048 34.0% 87.2%
Iowa     3     26,304,990 17,134,653 42.0% 96.2%
Kansas     4     21,123,539 17,718,474 41.5% 99.6%
Illinois     5     14,459,597 10,005,963 7.8% 96.0%
California     6     13,735,069 7,656,437 6.8% 14.1%
North Dakota     7     11,213,025 7,117,384 27.3% 77.9%
Minnesota     8     10,964,869     6,173,146 18.5% 75.8%
Colorado     9     10,852,376     7,400,525 19.3% 77.3%
Nebraska     10     7,211,092     6,789,447 19.3% 83.2%
New Mexico     11     6,892,087     5,059,905 19.6% 81.1%
Washington     12     6,677,261     1,932,582 6.3% 9.0%
Oregon     13     6,568,889     2,648,882 10.6% 17.0%
Indiana     14     6,216,030     3,281,987 6.1% 85.7%
Michigan     15     5,825,705     5,465,365 5.0% 58.7%
United States     –     295,882,483     201,230,237 7.2% 40.6%


For more information, a detailed methodology, and complete results, you can find the original report on Commodity.com’s website: https://commodity.com/blog/states-wind-energy/

startup

Cities With the Most Startup Businesses

Startups are a significant driver of the U.S. economy. Each year, thousands of entrepreneurs launch new businesses that create jobs and spur innovation and efficiency across the market. According to the U.S. Census Bureau, more than 420,000 startups accounted for 2.2 million new jobs in 2018.

Unfortunately, entrepreneurship in the U.S. has been declining for decades. In the late 1970s, the startup formation rate in the U.S.—defined as the number of new firms in a given year divided by the total number of firms—was nearly 14 percent. Four decades later, the rate was just above 8 percent

One of the major factors contributing to this trend is firm concentration. In recent decades, many sectors have shown a trend toward consolidation and greater concentration in the market, making large firms even larger and more successful through economies of scale, network effects, and other incumbent advantages.

Economic downturns also tend to slow startup formation, and the Great Recession’s effects on new business creation have proven to be especially stifling over the last decade. Unlike in past recessions, when a dip in startup activity has been followed by a period of growth, the overall startup formation rate fell in the wake of the Great Recession and has more or less remained flat at around 8 percent since. With less economic security due to a long, uncertain recovery, many potential entrepreneurs chose to minimize their risk and forgo new business opportunities. This is especially true of many would-be founders now in their late 20s and 30s, who graduated in a poor job market with large debt burdens.

This past year, the COVID-19 pandemic has brought even more economic hardship, and the unique circumstances of this downturn have created an even more complicated picture. In addition to the typical barriers to entrepreneurship that a recession creates, different industries face divergent fortunes in the era of shutdowns and social distancing. Certain sectors have become even more entrenched in daily life, creating new opportunities for growth in areas like e-commerce, video conferencing, online education, and collaboration tools. On the other hand, COVID-19 is likely to further suppress startup activity in many sectors like accommodation, food services, and retail. In recent years, these fields have experienced stagnant or declining startup formation rates. Today, the prospect of entering these industries will become even more daunting with consumer concerns about health and safety stifling demand and increasing overhead costs.

New startup formation is distributed unevenly across geographies as well as industries. Most of the states seeing the highest rates of new business creation are based in the western and southern U.S., led by Nevada (10.39 percent) and Florida (10.16 percent). Many of these states offer some combination of business-friendly policies, low individual and corporate tax rates, relatively low costs to operate, good educational institutions, and population growth that provides both a customer base and a market for labor.

Unsurprisingly, at the metro level, most of the leading hubs for startup formation are found in the states with the highest levels of startup activity. Many locations in the West and South continue to see strong rates of new business creation and associated job growth. To find out which metros are leading the way, researchers at Roofstock calculated the trailing five-year average startup formation—defined as the number of new firms in a given year divided by the total number of firms. The research team also analyzed the impact of startup activity on job growth.

Here are the large metropolitan areas with the most startup business activity.

Metro

Rank

Startup formation rate

Annual startup formations

Annual new jobs created by startups

Jobs created by startups as a percentage of all new jobs

Las Vegas-Henderson-Paradise, NV     1      11.44%     3,467     21,074 17.82%
Orlando-Kissimmee-Sanford, FL     2      10.95%     4,861     25,533 16.68%
Austin-Round Rock-Georgetown, TX     3      10.61%     3,858     21,357 16.49%
Miami-Fort Lauderdale-Pompano Beach, FL     4      10.46%     14,894     69,769 18.57%
Dallas-Fort Worth-Arlington, TX     5      9.82%     10,731     69,696 15.11%
Denver-Aurora-Lakewood, CO     6      9.64%     5,590     28,485 14.69%
Phoenix-Mesa-Chandler, AZ     7      9.63%     6,108     37,785 14.02%
Atlanta-Sandy Springs-Alpharetta, GA     8      9.52%     9,140     48,582 14.14%
Jacksonville, FL     9      9.50%     2,474     11,796 14.41%
Houston-The Woodlands-Sugar Land, TX     10      9.48%     9,214     55,475 14.44%
Los Angeles-Long Beach-Anaheim, CA     11      9.47%     24,718     144,716 18.05%
Tampa-St. Petersburg-Clearwater, FL     12      9.47%     5,174     25,792 12.31%
Riverside-San Bernardino-Ontario, CA     13      9.40%     4,867     28,137 16.10%
San Diego-Chula Vista-Carlsbad, CA     14      9.28%     5,599     27,338 15.13%
St. Louis, MO-IL     15      9.09%     4,715     19,078 12.22%
United States     –      8.13%     423,148     2,285,251 14.12%


For more information, a detailed methodology, and complete results, you can find the original report on Roofstock’s website: https://learn.roofstock.com/blog/cities-with-most-startups