New Articles

Sour News for Offshore Wind Farms

Offshore wind projects include shipments of export cargo and import cargo in international trade.

Sour News for Offshore Wind Farms

The Inflation Reduction Act earmarked generous subsidies to supercharge US green investment. Yet, one of those green investments – offshore wind projects – is struggling to turn a profit. This is leading to the delay and outright shutdown of some of the nation’s largest, and most promising projects.

Offshore wind farms have always held great promise. To begin, they produce more energy than onshore farms due to the strength of the wind and its regular flow at sea. An offshore wind farm’s environmental footprint is also smaller than traditional fossil fuel power plants and countries with access to the sea can naturally increase their installation and production capabilities. 

The challenges for offshore wind farms, however, are also just as noticeable. First, corrosive saltwater, harsh weather conditions, and strong currents make the wind turbines at sea more complicated to build as well as maintain. Second, although offshore wind farms are less pricey than a decade ago, they still remain more expensive to build than many other forms of renewable energy. Lastly, the transmission lines (undersea cables) are an additional cost that is not needed with onshore farms to ultimately connect the offshore farm to the power grid. 

Ørsted is a Danish renewable energy firm and one of the largest offshore wind farm developers. Earlier in the month the company announced it had lost a quarter of its market value due to debilitating impairments surrounding three wind projects off the east coast. This resulted in a downgrading of Ørsted’s stock which will hinder their ability to raise debt to fund future plans. Higher interest rates, rising costs, and permitting delays have hampered the Danish firm and this will certainly affect President Biden’s plans to have 30 gigawatts of offshore energy by 2030. As of today, the US has less than 50 megawatts. 

Two other giants – Avangrid and Shell – have called it quits on offshore developments and many of the leading firms that fabricate offshore turbine blades are hemorrhaging money. Rising interest rates are the most concerning for offshore wind projects as the farms take much longer to build than other renewable projects. The upfront costs, as mentioned earlier, only add to the problem. The cost per kilowatt of building a solar facility is roughly $1,050. For onshore farms, it increases to $1,360, but for offshore wind farms, the expense is four-fold ($4,000 + per kilowatt). 

In general, offshore wind projects are not linked to inflation. Developers take on a substantial risk in high inflationary environments as their future revenue is already locked in and input costs end up ravaged by rising prices. This eats into profits and the developer’s ability to get the farm up and running. While offshore wind farms hold promise, they might only make sense when the economy is healthy and thriving. Now is just not the time. 

wind

Growing Demand for Lightweight Wind Blades to Augment Carbon Fiber Prepreg Market through 2027

The global carbon fiber prepreg industry is slated to record rapid growth from rising demand for greater durability, fuel efficiency, and low-weight components from the aerospace and automotive sectors. Carbon fiber prepreg is a reinforced fabric made from pre-impregnated and cured polymer matrix.

The material offers a high stiffness to weight ratio and superior resistance against chemicals and fatigue. Owing to these advantages, prepreg carbon fibers find a broad range of applications across a plethora of industrial avenues.

The incorporation of carbon fiber prepreg in automobiles drastically reduces the overall vehicle weight without compromising on strength. This leads to higher fuel efficiency and performance improvement in vehicles. Stringent carbon emission norms and growing demand for fuel-efficient vehicles are encouraging motor vehicle manufacturers to incorporate more of these carbon materials in their product portfolios.


Moreover, with growing automotive production, the demand for carbon fiber prepreg is likely to go up to a large extent. As per the International Organization for Motor Vehicle Manufacturers, nearly 77.62 million commercial vehicles and cars were produced in 2020.

According to the latest industry report by Global Market Insights, Inc., the global carbon fiber prepreg market size is anticipated to grow considerably by 2027.

Carbon fiber prepreg materials are seeing a very promising application scope in the aerospace industry. Various aircraft manufacturers are increasingly refurbishing aircraft with these reinforced carbon fibers in a view to minimize aircrafts’ weight, enhance gasoline mileage, and provide affordable & safe air transportation services to the customers.

Carbon fiber prepreg also boasts of many other applications, including sporting goods, racing vehicles, pressure vessels, and commercial products. There has been an increasing demand for light-weight high-strength materials, particularly in racing vehicles, including bikes and cars, to make them lighter and hence, amplify their velocity and stability on the racetracks. Meanwhile, various sporting goods manufacturers are emphasizing on utilizing soft carbon fabrics to provide comfort to their customers, opening up additional avenues of business growth.

Carbon fiber prepreg industry share from wind power plants is expected to witness substantial momentum in the forthcoming years. This is owing to the growing utilization of pre-impregnated carbon fibers in wind blades. These materials offer high tensile and compressive strength due to which they are broadly adopted for the latest generations of wind turbines.

In addition, the material’s use provides a number of cost and performance benefits to the wind industry. According to Sandia National Laboratories, wind blades made from carbon fibers weigh 25% less than the ones made from fiberglass materials. This means that the carbon fiber wind turbine blades can be much longer than the ones made out of fiberglass. As a result, the wind turbines can effectively harness more energy across locations that were previously deemed as low wind areas.

Electricity generation through renewable sources is surging rapidly in developed countries. As per the U.S. Department of Energy, wind power is the second-largest source of electricity generation in the country, which accounted for a total installed capacity of 105.6 GW in 2019. With carbon fiber wind turbine blades pegged to become industry standard, the adoption of carbon fiber prepreg materials is expected to witness a  significant jump.

The North American carbon fiber prepreg industry is slated to hold a considerable share of the global market, particularly owing to growing demand from the automotive and aerospace industries. Leading OEMs in the country are focusing on employing lightweight materials in automobiles to enhance fuel efficiency and comply with stringent vehicles emission norms set by the government. Growing penetration of electric vehicles and rising preference for air travel are some of the more notable factors that would foster business growth in the country.

Park Aerospace Corp (previously Park Electrochemical Corporation), Hexcel Corporation, Toray Industries, Mitsubishi Rayon Co. Ltd., Gurit Holdings AG, Axiom Materials, SGL Group, and Solvay SA are some prominent companies operating in global carbon fiber prepreg industry. These pre-impregnated carbon fiber manufacturers are eyeing focusing on leveraging novel technologies to produce highly efficient materials and cater to the larger consumer base.

Soaring adoption of lightweight, high-strength materials in numerous industries, to cater to the rising demand for efficiency, would outline the industry outlook. Additionally increasing environmental regulations to curb emission is also forecast to complement global carbon fiber prepreg industry trends.

renewable energy

States That Produce the Most Renewable Energy

Since President Joe Biden and a new Congress took office earlier this year, federal policymakers have been working to speed up the U.S. transition to clean and renewable energy sources. One of Biden’s first actions in office was to rejoin the Paris Climate Accord, the 2016 agreement in which countries pledged to significantly reduce their CO2 emissions. The Biden Administration followed this up with aggressive carbon reduction targets and the American Jobs Plan proposal, which includes provisions to modernize the power grid, incentivize clean energy generation, and create more jobs in the energy sector. Much of Biden’s agenda builds on prior proposals like the Green New Deal, which would achieve emissions reductions and create jobs through investments in clean energy production and energy-efficient infrastructure upgrades.


The transition to renewables has taken on greater urgency in recent years with the worsening effects of climate change. Carbon emissions from non-renewable sources like coal, oil, and natural gas are one of the primary factors contributing to the warming of the atmosphere, and climate experts project that to limit warming, renewable energy must supply 70 to 85% of electricity by midcentury.

Renewable energy still represents less than a quarter of total annual electricity generation in the U.S., but the good news is that renewable energy has been responsible for a steadily increasing share of electricity generation over the past decade. Most of the upward trajectory comes from exponential growth in the production of solar and wind power. In 1990, solar power generated only 367,087 megawatt-hours of electricity, while wind power was responsible for 2,788,600 megawatt-hours. Since then, technological improvements and public investment in wind and solar helped lower costs and make them viable competitors to non-renewable sources. By 2020, solar production had reached 89,198,715 megawatt-hours, while wind produced 337,938,049 megawatt-hours of electricity.

But this evolution is uneven across the U.S., a product of differences in states’ economies, public policy toward renewables, and perhaps most importantly, geographic features. Even among states that lead in renewable energy production, these factors contribute to different mixes of renewable sources. For instance, Texas—the nation’s top producer of renewable energy—generates most of its renewable electricity from wind turbines. Runner-up Washington and fourth-place Oregon take advantage of large rivers in the Pacific Northwest to generate more hydroelectric power than any other state. And California, which is third in total renewable production, has been a long-time leader in solar energy thanks in part to an abundance of direct sunlight.

Meanwhile, states that lag behind in renewable generation include several states without the size or geographic features to scale up production, like Delaware, Rhode Island, and Connecticut, along with states whose economies are more traditionally dependent on fossil fuels, like Mississippi and Alaska.

To determine the states producing the most renewable energy, researchers at Commodity.com used data from the U.S. Energy Information Administration to calculate the percentage of total electricity generated from renewable sources. Renewable energy sources include wind, solar, geothermal, biomass, and hydroelectric. In the event of a tie, the state with the greater five-year growth in renewable electricity production, between 2015 and 2020, was ranked higher.

Here are the states that produce the most renewable energy.

State
Rank
Percentage of electricity generated from renewables
5-year change in renewable electricity production
Total electricity generated from renewables (MWh)
Largest renewable energy source
Vermont    1     99.9% +9.0% 2,155,177 Hydroelectric Conventional
South Dakota    2     80.5% +55.0% 11,388,457 Hydroelectric Conventional
Maine    3     76.7% -1.7% 7,674,956 Hydroelectric Conventional
Idaho    4     76.1% +15.0% 13,456,149 Hydroelectric Conventional
Washington    5     75.0% +5.6% 87,109,288 Hydroelectric Conventional
Oregon    6     67.5% +9.5% 42,928,468 Hydroelectric Conventional
Iowa    7     59.4% +85.6% 35,437,099 Wind
Montana    8     59.4% +16.8% 13,872,119 Hydroelectric Conventional
Kansas    9     44.2% +117.6% 24,117,519 Wind
California    10     42.6% +38.9% 82,239,832 Solar Thermal and Photovoltaic
Oklahoma    11     39.7% +91.9% 32,687,539 Wind
North Dakota    12     38.1% +87.0% 16,084,768 Wind
Colorado    13     30.9% +77.4% 16,724,964 Wind
Alaska    14     30.8% +8.3% 1,931,545 Hydroelectric Conventional
Nebraska    15     28.9% +115.7% 10,648,740 Wind
United States    –     19.5% +43.9% 783,003,365 Wind


For more information, a detailed methodology, and complete results, you can find the original report on Commodity.com’s website: https://commodity.com/blog/states-renewable-energy/

wind energy production

U.S. States Producing the Most Wind Energy

“Meteoric” is one way to describe wind energy’s rise to the top of America’s renewable energy industry.

Amid repeated calls from scientists and activists to undertake measures to curb global warming, lawmakers, politicians, and the energy industry have responded. Foremost in that effort is the call for carbon-free energy production via alternative energy sources like wind and solar. Many states have followed suit, with governors from coast to coast implementing wide-ranging initiatives meant to gradually reduce the carbon footprint of power generation in the coming years.

Wind generation is at the leading edge of the movement toward clean energy production. Fields of wind turbines across the country have slowly started to increase their proportion of total energy production. And just this year, President Joe Biden announced measures meant to accelerate the development of offshore wind energy.

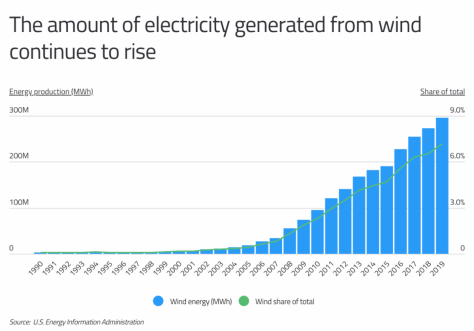
While U.S. offshore wind production currently lags behind that of other developed nations, its onshore capacity is second only to China. Wind energy’s share of total utility-scale electricity generation in the U.S. grew from less than 1% in 1990 to about 8% last year.

In 2019, more than $13 billion was invested in wind power, and the amount of new generation capacity added to the nation’s electrical grids through wind projects was greater than all other sources except natural gas. Driving the investment may be the simple fact that it’s far cheaper to install wind farms than it is to build hydroelectric plants and solar farms. Alongside the value, the federal government subsidized wind construction with tax credits. The result? Wind generation exceeded hydroelectric power for the first time in 2019.

While tax credits and reasonable construction costs have increased wind’s popularity, perhaps its greatest advantage is availability. Wind regularly barrels across the Midwest and the Texas-Oklahoma border at average speeds of 20 to 30 miles per hour, a key speed range, as turbines reach their rated generation capacity when winds hit 26 to 30 miles per hour.

This explains why the Midwest and the West South Central region are home to the top wind-generated electricity producers in the nation. Texas leads the nation in total wind energy production, generating more than twice as much wind electricity as the next state. And while the Lone Star State’s wind energy makes up a significant portion of its renewable energy generation (92%), Kansas’ renewable energy generation relies on wind more than any other state. Kansas’ wind turbines produce more than 99% of its renewable energy and 42% of total.

The data used in this analysis is from the U.S. Energy Information Administration. To determine the states producing the most wind energy, researchers at Commodity.com calculated each state’s annual wind energy production, measured in megawatt-hours. Researchers also calculated the absolute change in wind energy production since 2010, wind’s share of total energy production, and wind’s share of total renewable energy production.

Here are the states producing the most wind energy.

State Rank Annual wind energy production (MWh) Change in wind energy production since 2010 (MWh) Wind share of total energy production Wind share of total renewable energy production


Texas     1     83,620,371 57,368,961 17.3% 92.0%
Oklahoma     2     29,008,131 25,200,048 34.0% 87.2%
Iowa     3     26,304,990 17,134,653 42.0% 96.2%
Kansas     4     21,123,539 17,718,474 41.5% 99.6%
Illinois     5     14,459,597 10,005,963 7.8% 96.0%
California     6     13,735,069 7,656,437 6.8% 14.1%
North Dakota     7     11,213,025 7,117,384 27.3% 77.9%
Minnesota     8     10,964,869     6,173,146 18.5% 75.8%
Colorado     9     10,852,376     7,400,525 19.3% 77.3%
Nebraska     10     7,211,092     6,789,447 19.3% 83.2%
New Mexico     11     6,892,087     5,059,905 19.6% 81.1%
Washington     12     6,677,261     1,932,582 6.3% 9.0%
Oregon     13     6,568,889     2,648,882 10.6% 17.0%
Indiana     14     6,216,030     3,281,987 6.1% 85.7%
Michigan     15     5,825,705     5,465,365 5.0% 58.7%
United States     –     295,882,483     201,230,237 7.2% 40.6%


For more information, a detailed methodology, and complete results, you can find the original report on Commodity.com’s website: https://commodity.com/blog/states-wind-energy/