New Articles

The Best-Paying Cities for Agricultural Workers

agricultural

The Best-Paying Cities for Agricultural Workers

Agriculture has been and remains one of the most important industries for the U.S. economy. In addition to directly providing food for the population in the form of produce and livestock, the broader agricultural sector—which includes farming, fishing, and forestry—provides raw materials that form the foundation of other industries like food service, construction, and textile manufacturing. Further, the U.S. is the world’s leading exporter of food and other agricultural products, which contributes to its global economic and political influence.

While agriculture’s role in the U.S. economy remains significant, the industry’s future in the U.S. faces many challenges. Global climate change has produced warmer temperatures and more frequent severe weather events like droughts and fires, threatening an increasing number of crops, livestock, and forests. Agricultural exports have been negatively impacted by recent trade disputes with other countries, and imports on agricultural equipment have become more expensive. And on top of these more recent challenges, agriculture has been undergoing a long-term decline as a share of the economy: farms alone represented more than 3% of GDP in the early 1960s but only account for less than 1% of U.S. GDP today.

Another indicator of agriculture’s shifting role in the economy is its employment numbers. Since the end of World War II, the total number of workers in agriculture and related industries has been on a steady decline over time. In the late 1950s, the U.S. economy had more than 8 million workers supporting agriculture. That figure had been cut in half within two decades, and today, agricultural-related employment hovers around 2.3 million, according to data from the Bureau of Labor Statistics.

One of the major reasons for this decline is agricultural and mechanical innovations that have reduced the need for manual labor. Simultaneously, other sectors of the economy have grown, offering new and more appealing opportunities in different fields and professions. Working conditions for agricultural workers are also some of the most difficult and hazardous of any profession, and these workers face some of the lowest wages of any profession in the U.S. According to BLS data, the median pay for farming, fishing, and forestry occupations is less than $30,000 per year, or about 30% below the median of $41,950 across all occupations.

However, certain states offer far better pay than others, especially after adjusting for cost-of-living differences. Despite above-average living costs, Alaska stands out as the best-paying state for these workers, where the typical agricultural worker earns an adjusted wage of more than $43,000 annually. Outside of Alaska, states in the Central U.S. offer the most competitive wages. At the other end of the spectrum, the list of lowest-paying states includes Florida, California, and New Jersey, where workers earn an adjusted wage of approximately $25,000 or less.

At the metro level, the Central U.S. is also well-represented on the list of best-paying U.S. locations for agricultural workers. Among large metropolitan areas, these include Indianapolis, Oklahoma City, Columbus, and St. Louis.

To find the best-paying locations for agricultural workers, researchers at Commodity.com analyzed data from the U.S. Bureau of Labor Statistics and the U.S. Bureau of Economic Analysis. Researchers calculated the median annual earnings for farming, fishing, and forestry occupations, which were adjusted for cost-of-living differences. Only metropolitan areas with at least 100,000 residents were included.

Here are the best-paying large metros for agricultural workers.

Metro Rank        Median annual earnings   for agricultural workers (adjusted) Median annual earnings for agricultural workers (unadjusted) Number of agricultural workers Cost of living (compared to national average)


Indianapolis-Carmel-Anderson, IN 1 $42,854 $39,040 300 -8.9%
Oklahoma City, OK 2 $40,122 $36,030 680 -10.2%
New Orleans-Metairie, LA 3 $39,044 $36,350 500 -6.9%
Columbus, OH 4 $37,707 $34,540 940 -8.4%
Buffalo-Cheektowaga-Niagara Falls, NY 5 $37,598 $35,530 70 -5.5%
Pittsburgh, PA 6 $37,500 $34,650 550 -7.6%
Richmond, VA 7 $36,138 $34,620 690 -4.2%
Salt Lake City, UT 8 $35,507 $35,010 210 -1.4%
St. Louis, MO-IL 9 $34,573 $31,150 1,390 -9.9%
Virginia Beach-Norfolk-Newport News, VA-NC 10 $34,191 $32,960 760 -3.6%
Birmingham-Hoover, AL 11 $33,873 $29,910 630 -11.7%
Louisville/Jefferson County, KY-IN 12 $33,795 $30,280 520 -10.4%
Baltimore-Columbia-Towson, MD 13 $33,393 $35,330 1,700 +5.8%
Cleveland-Elyria, OH 14 $33,382 $30,010 270 -10.1%
Minneapolis-St. Paul-Bloomington, MN-WI 15 $33,294 $34,260 1,350 +2.9%
United States $29,670 $29,670 478,770 N/A


For more information, a detailed methodology, and complete results, you can find the original report on Commodity.com’s website: https://commodity.com/blog/agricultural-wages/

agriculture agricultural foreign

State Economies Most Dependent on Agriculture

The past few years have been challenging ones for the agriculture industry. The threat of global climate change has continued to produce warmer temperatures and more extreme weather events that threaten crops and livestock, and this summer, the U.S. is currently experiencing serious drought in some of its key agricultural regions in California, the upper Midwest, and the Southeast. Trade policies under the Trump Administration reduced agricultural exports and incomes while raising costs on imports of key equipment and supplies. The COVID-19 pandemic brought additional uncertainty to commodity markets and has continued to disrupt the supply chains that farmers rely on to sell their products.

These recent difficulties have made it harder than ever to prosper as a farmer, particularly on smaller-scale farms. But long-term trends suggest that agriculture’s role in the economy has been shifting for much longer. What has historically been one of America’s most important industries now has a starkly diminished role in terms of job creation and GDP.

Farm employment has steadily decreased in the postwar era—as far back as the BEA’s data goes—but really for more than a century. As more of America moved out of rural areas and into denser, more economically varied communities following the Industrial Revolution and the growth of manufacturing and other industries, fewer people remained working on farms. This trend has continued in the modern era even more rapidly as agricultural processes have become more efficient and economic opportunities in other sectors have grown.

Agricultural activities have also dropped as a share of GDP in recent decades. After reaching nearly 3.5% of GDP in the early 1970s, farming today represents 0.63% of the economy. One of the reasons for this decline is that farming’s economic value has simply been outstripped by growth in other sectors.

But the downward trends in agriculture as an employer and economic engine in the U.S. should not be taken as signs that the industry is going away. By the measure of total factor productivity—essentially a ratio of agricultural inputs like land, labor, capital, and materials to outputs of crops and livestock—farms today are far more productive than they have ever been, part of a long-running trend dating back to at least the late 1940s.

One of the main factors behind this growth in productivity has been technological innovation in the agricultural sector. Improved seeds and fertilizers, pesticides and other crop protection techniques, and more efficient tools for harvesting and processing agricultural products have all contributed to increased yields and productivity. Farms have also increasingly shifted toward monoculture, producing fewer types of crops or livestock, to achieve economies of scale.

While these shifts over time have moved the U.S. away from a heritage of small, independent farmers, agriculture remains big business and a leading industry in many states. Many of the U.S.’s rural states around the Great Plains region remain highly reliant on agriculture, as their abundant land, good soil, and climate provide favorable conditions for raising crops and livestock.

To identify the states most dependent on agriculture, researchers at Commodity.com used data from the U.S. Bureau of Economic Analysis to calculate the percentage of total state GDP accounted for by farms in each state. Farms include establishments engaged in crop and animal production mainly for food and fiber. Researchers also calculated the farm industry’s share of total employment, and reported that data alongside the total GDP from farming and total farm employment in each state.

Here are the state economies most dependent on agriculture.

State Rank      Farming share of GDP   Farming share of total employment   Total farming GDP  

Total farming employment

South Dakota   1 5.78% 5.07% $3,174,300,000 31,273
Nebraska   2 4.62% 4.07% $6,005,200,000 54,700
North Dakota   3 4.46% 4.85% $2,551,300,000 28,484
Iowa   4 4.30% 4.24% $8,374,200,000 88,874
Idaho   5 4.28% 3.93% $3,583,400,000 42,154
Montana   6 3.23% 4.30% $1,711,600,000 29,879
Kansas   7 2.55% 3.23% $4,501,000,000 62,910
Wyoming   8 1.66% 3.58% $671,800,000 14,781
New Mexico   9 1.28% 2.49% $1,347,600,000 28,135
Mississippi   10 1.27% 2.42% $1,478,000,000 39,132
Minnesota   11 1.27% 1.97% $4,880,500,000 75,401
Oklahoma   12 1.26% 3.27% $2,547,100,000 76,389
Wisconsin   13 1.25% 2.31% $4,358,500,000 86,560
Vermont   14 1.13% 2.11% $385,600,000 9,316
Kentucky   15 1.06% 3.21% $2,282,200,000 82,641
United States   – 0.63% 1.28% $136,080,000,000 2,601,000


For more information, a detailed methodology, and complete results, you can find the original report on Commodity.com’s website: https://commodity.com/blog/state-economies-agriculture/

wind energy production

U.S. States Producing the Most Wind Energy

“Meteoric” is one way to describe wind energy’s rise to the top of America’s renewable energy industry.

Amid repeated calls from scientists and activists to undertake measures to curb global warming, lawmakers, politicians, and the energy industry have responded. Foremost in that effort is the call for carbon-free energy production via alternative energy sources like wind and solar. Many states have followed suit, with governors from coast to coast implementing wide-ranging initiatives meant to gradually reduce the carbon footprint of power generation in the coming years.

Wind generation is at the leading edge of the movement toward clean energy production. Fields of wind turbines across the country have slowly started to increase their proportion of total energy production. And just this year, President Joe Biden announced measures meant to accelerate the development of offshore wind energy.

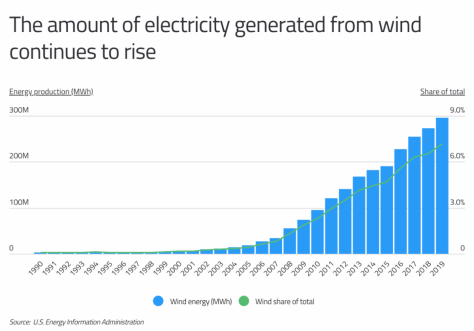
While U.S. offshore wind production currently lags behind that of other developed nations, its onshore capacity is second only to China. Wind energy’s share of total utility-scale electricity generation in the U.S. grew from less than 1% in 1990 to about 8% last year.

In 2019, more than $13 billion was invested in wind power, and the amount of new generation capacity added to the nation’s electrical grids through wind projects was greater than all other sources except natural gas. Driving the investment may be the simple fact that it’s far cheaper to install wind farms than it is to build hydroelectric plants and solar farms. Alongside the value, the federal government subsidized wind construction with tax credits. The result? Wind generation exceeded hydroelectric power for the first time in 2019.

While tax credits and reasonable construction costs have increased wind’s popularity, perhaps its greatest advantage is availability. Wind regularly barrels across the Midwest and the Texas-Oklahoma border at average speeds of 20 to 30 miles per hour, a key speed range, as turbines reach their rated generation capacity when winds hit 26 to 30 miles per hour.

This explains why the Midwest and the West South Central region are home to the top wind-generated electricity producers in the nation. Texas leads the nation in total wind energy production, generating more than twice as much wind electricity as the next state. And while the Lone Star State’s wind energy makes up a significant portion of its renewable energy generation (92%), Kansas’ renewable energy generation relies on wind more than any other state. Kansas’ wind turbines produce more than 99% of its renewable energy and 42% of total.

The data used in this analysis is from the U.S. Energy Information Administration. To determine the states producing the most wind energy, researchers at Commodity.com calculated each state’s annual wind energy production, measured in megawatt-hours. Researchers also calculated the absolute change in wind energy production since 2010, wind’s share of total energy production, and wind’s share of total renewable energy production.

Here are the states producing the most wind energy.

State Rank Annual wind energy production (MWh) Change in wind energy production since 2010 (MWh) Wind share of total energy production Wind share of total renewable energy production


Texas     1     83,620,371 57,368,961 17.3% 92.0%
Oklahoma     2     29,008,131 25,200,048 34.0% 87.2%
Iowa     3     26,304,990 17,134,653 42.0% 96.2%
Kansas     4     21,123,539 17,718,474 41.5% 99.6%
Illinois     5     14,459,597 10,005,963 7.8% 96.0%
California     6     13,735,069 7,656,437 6.8% 14.1%
North Dakota     7     11,213,025 7,117,384 27.3% 77.9%
Minnesota     8     10,964,869     6,173,146 18.5% 75.8%
Colorado     9     10,852,376     7,400,525 19.3% 77.3%
Nebraska     10     7,211,092     6,789,447 19.3% 83.2%
New Mexico     11     6,892,087     5,059,905 19.6% 81.1%
Washington     12     6,677,261     1,932,582 6.3% 9.0%
Oregon     13     6,568,889     2,648,882 10.6% 17.0%
Indiana     14     6,216,030     3,281,987 6.1% 85.7%
Michigan     15     5,825,705     5,465,365 5.0% 58.7%
United States     –     295,882,483     201,230,237 7.2% 40.6%


For more information, a detailed methodology, and complete results, you can find the original report on Commodity.com’s website: https://commodity.com/blog/states-wind-energy/

fossil fuels

U.S. States Most Dependent on Fossil Fuels

With the effects of global climate change becoming increasingly apparent, policymakers across the U.S. are moving to reduce the nation’s reliance on carbon-based fossil fuels.

At the beginning of his term, President Joe Biden rejoined the Paris Climate Accord, and in April, the Biden Administration announced aggressive new greenhouse gas reduction goals, including an overall aim to reduce U.S. greenhouse gas pollution to half of 2005 levels by 2030. Meanwhile, nearly 40 states have adopted renewable portfolio standards to facilitate a transition away from fossil fuels for energy production to renewables.

Despite these efforts, however, fossil fuel consumption remains deeply entrenched in the U.S. economy, and it could take years to transition away from fossil fuels as the country’s primary energy source.

Petroleum remains the leading source of energy in the U.S., accounting for approximately one-third of energy consumed. Energy consumption from natural gas expanded over the last decade as the rise of hydraulic fracturing made it less costly to extract. Most of that growth has come at the expense of coal, which represented 22.7% of the energy consumed in 2008 but just 13.1% a decade later. And while nuclear has held steady and renewables have continued to grow with improved technology and greater scale, fossil fuels still represent more than 80% of total energy consumption in the U.S. each year.

One example of the difficulties of shifting away from fossil fuels is consumers’ relationship to gasoline and car travel. Recently, gasoline prices have been on the rise again: prices dropped sharply in 2020, as many travelers and commuters stayed off the roads during the COVID-19 pandemic. Now, with many public health restrictions being relaxed as cases decline and more people get vaccinated, prices have topped $3 per gallon nationally for the first time since 2014. But despite what the laws of supply and demand might suggest, rising prices do not strongly affect driver behavior: research shows they tend to purchase the same amount of gasoline regardless of how much it costs. Instead, breaking drivers’ reliance on fossil fuels will depend on auto manufacturers providing more hybrid and electric options, whether by choice or by policy, like California’s zero-emission vehicle regulations.

State-level data reinforces that there is a long way to go before the transition away from fossil fuels is complete. Every single U.S. state derives at least 50% of its energy from fossil fuels, and a total of nine states derive more than 90% of their energy from fossil fuels. Among the most dependent are small states like Delaware and Rhode Island, which import most of their energy from elsewhere, and states with rich stores of fossil fuels, like Alaska, West Virginia, and Kentucky. At the other end of the spectrum are states like Washington, Oregon, and New Hampshire, which rely more on nuclear and renewables like hydroelectric power and derive less than 60% of their energy from fossil fuels.

To find the states most dependent on fossil fuels, researchers at Commodity.com used data from the U.S. Energy Information Administration to calculate the percentage of total primary energy consumption from coal, natural gas, and petroleum in 2018 (the most recent available data). Researchers also calculated the percentage of total primary energy consumption derived from renewable sources, as well as the largest fossil fuel source.

Here are the states most dependent on fossil fuels.

State Rank Percentage of energy derived from fossil fuels Percentage of energy derived from renewables Total energy consumed from fossil fuels (trillion BTU) Total energy consumed from renewables (trillion BTU) Largest fossil fuel source


Delaware     1     96.4% 3.6% 213.1 8.0 Petroleum
Alaska     2     95.9% 4.1% 584.8 25.0 Natural Gas
West Virginia     3     95.4% 4.6% 1,103.3 53.7 Coal
Rhode Island     4     95.0% 5.0% 189.1 10.0 Natural Gas
Kentucky     5     94.1% 5.9% 1,616.5 102.1 Coal
Wyoming     6     93.5% 6.5% 793.2 54.9 Coal
Indiana     7     93.4% 6.6% 2,617.2 185.9 Coal
Utah     8     93.1% 6.9% 830.0 61.3 Petroleum
Louisiana     9     92.1% 3.7% 3,895.5 155.0 Petroleum
Texas     10     89.9% 7.1% 12,752.3 1,009.0 Petroleum
Ohio     11     89.7% 4.7% 3,040.2 158.6 Natural Gas
Hawaii     12     89.4% 10.6% 261.8 31.1 Petroleum
Colorado     13     88.8% 11.2% 1,305.1 164.6 Natural Gas
Mississippi     14     88.2% 6.1% 1,116.6 76.8 Natural Gas
Missouri     15     88.0% 5.9% 1,608.7 108.5 Coal
United States     –     80.5% 11.2% 81,238.0 11,281.6 Petroleum


For more information, a detailed methodology, and complete results, you can find the original report on Commodity.com’s website: https://commodity.com/blog/states-fossil-fuels/

solar energy

States Producing the Most Solar Energy

In the first few months of his administration, one of President Joe Biden’s top policy priorities has been addressing the threat of climate change—while also improving infrastructure and creating jobs to generate economic growth. Biden has stated a goal of reaching 100% pollution-free electricity by 2035, which means dramatically scaling up renewable energy production in the U.S. To that end, Biden’s proposed American Jobs Plan would include extensive tax credits, grants, and other investments in clean energy.

One of the potential beneficiaries of this focus is the solar power industry, which is seeing rapid growth as the costs associated with solar decline. For many years, solar power was too expensive to be adopted at scale as a major source of energy production, but this has changed in recent years.

One of the biggest reasons for the decline in costs has been technological innovation. Solar technology has become more reliable and more efficient over time, which lowers the cost of generating energy. As those costs decrease, adoption becomes more common, which allows solar cell manufacturers to achieve economies of scale and lower prices even further.

Government support has also been a major factor: billions in federal investment for renewables during the Great Recession helped spur the technological advances seen in the last decade, and the federal government—along with many states and localities—has long offered tax breaks and other incentives to subsidize household solar adoption.

These factors reached an inflection point in the mid-2000s, and solar production in the U.S. has been growing exponentially ever since. In 2006, solar generated around 507,000 megawatt-hours of energy and represented .01% of U.S. energy generated by the electric power industry. By 2019, solar thermal and photovoltaic accounted for 71,936,822 megawatt-hours—around 140 times more than in 2006—to represent 1.74% of the total.

Solar is still a relatively small part of the U.S.’s overall energy mix but will become an increasingly significant source as solar production continues to accelerate—particularly if the Biden Administration’s climate policies and clean energy investments come to pass. For now, however, renewables overall (17.7% of total electricity generation) still lag behind natural gas (38.4%), coal (23.4%), and nuclear (19.6%). Within the renewable category, solar (9.9% of renewable production) trails wind (40.6%) and hydroelectric (39.5%).

Despite its small but growing role in overall U.S. energy production, solar is a major part of the energy mix in a number of states. The undisputed leader of these states is California, which leads all others both by total solar energy production and the share of electricity derived from solar. California’s total solar energy production is nearly four times that of the runner-up state, North Carolina. Many of the market factors that have made solar more popular nationwide hold in California, too, but the Golden State also has geographic features and a political climate that have made it a solar leader.

In terms of geography, California is one of the U.S. states with the highest levels of insolation, or exposure to the sun. Insolation is a factor for many other leading states for solar production, including Sun Belt locations like Texas, Southwestern states Nevada and Arizona, and Southeastern states North Carolina, Georgia, and Florida. Politically, California’s policymakers have created an environment that all but guarantees heavy reliance on solar energy. For instance, California has one of the most ambitious renewable portfolio standards of any U.S. state, with a goal of generating 60% of energy from renewables by 2030 and 100% of energy from renewables by 2045. Additionally, in 2020, the state began requiring most new homes to include rooftop solar panels.

To find the states where solar production is highest, researchers at Commodity.com used data from the U.S. Energy Information Administration’s Electricity Power Data. States were ranked by annual solar production for electric power (in megawatt-hours) for 2019. The researchers also calculated the year-over-year change in total solar energy production from 2018–2019, as well as what percentage of total energy production and renewable energy production solar accounts for.

Here are the states producing the most solar energy.

State


Rank


Annual solar energy production (Megawatt-hours)


Change in solar energy production (YoY)


Solar share of total energy production


Solar share of total renewable energy production


California    1    28,331,513 +5.0% 14.0% 29.1%
North Carolina    2    7,451,338 +21.9% 5.7% 44.6%
Arizona    3    5,278,019 +2.7% 4.6% 43.0%
Nevada    4    4,810,511 +1.9% 12.1% 42.4%
Texas    5    4,365,125 +36.2% 0.9% 4.8%
Florida    6    3,901,445 +61.7% 1.6% 45.6%
Utah    7    2,186,424 -1.7% 5.6% 51.3%
Georgia    8    2,160,770 +8.3% 1.7% 18.8%
New Mexico    9    1,365,900 +1.3% 3.9% 16.1%
Minnesota    10    1,248,833 +19.8% 2.1% 8.6%
Colorado    11    1,218,220 +14.7% 2.2% 8.7%
New Jersey    12    1,164,721 +17.6% 1.6% 57.9%
Massachusetts    13    1,163,776 +19.0% 5.4% 34.7%
Virginia    14    949,111 +24.4% 1.0% 15.3%
South Carolina    15    858,546 +68.2% 0.9% 14.3%
United States    –    71,936,822 +12.7% 1.7% 9.9%


For more information, a detailed methodology, and complete results, you can find the original report on Commodity.com’s website: https://commodity.com/blog/states-solar-energy/

energy exports

U.S. States that Export the Most Energy

The energy economy in the United States has been transformed over the last 15 to 20 years, reducing reliance on some traditional fuel sources while bringing others to the forefront.

The main factors driving this shift have been the increased use of natural gas and renewable energy. The emergence of fracking has reduced the costs of natural gas extraction and led to a boom in domestic production over the past couple of decades. Simultaneously, new innovations in renewable energy sources like solar and wind power have reduced costs and made these alternatives more viable at scale. With the adoption of natural gas and renewables, production and consumption of formerly predominant sources like oil and coal have leveled off or declined.

This transition has also shifted the U.S. political economy around energy. Nationally, political figures have called for U.S. energy independence from imported foreign fuel resources for years, hoping to reduce reliance on other nations in the event of geopolitical conflicts. Because of the U.S.’s increased production of domestic energy sources, the country has made rapid progress toward that goal in recent years.

In 2019, the United States was a net exporter of energy for the first time since 1957, meaning that it produced more energy than it consumed. With a sharp increase in production over the past twenty years, production has begun to catch up with consumption and exports with imports. The nation’s net imports of coal and coke, natural gas, and petroleum have all fallen below zero, leaving only crude oil as a major fuel import—and even imports in that category are showing a decline.

Within the U.S., states have different levels of production and consumption affecting their import and export levels as well. While some states—especially those who produce coal in large numbers—have suffered in the transition between fuels, others have dramatically increased their energy production. As a result, these states are now producing far more energy on a per capita basis than peer states are.

This is particularly true for two of the states at the front of the natural gas boom, Wyoming and North Dakota. These states lead the nation in both total energy production on a per capita basis, a function of both their high levels of production and their low populations.

Interestingly, Wyoming and North Dakota are among the nation’s leaders in per capita energy consumption levels as well. One of the reasons is that extracting and refining fuel is itself an energy-intensive process—which is why some of the other leading states for energy consumption per capita are also major fuel producers, like Alaska and Louisiana.

Despite their high consumption levels, leading states Wyoming and North Dakota nonetheless have the highest net energy exports per capita, followed by other major energy producers like West Virginia, New Mexico, and Alaska. To find these locations, researchers at Commodity.com used data from the U.S. Energy Information Administration’s Electric Power Annual Report and ranked states based on their net energy exports per capita—calculated as the difference between per capita production and consumption.

Here are the states that export the most energy.

State Rank Net energy exports per capita (million Btu) Total energy production per capita (million Btu) Total energy consumption per capita (million Btu) Net energy exports (trillion Btu) Total energy production (trillion Btu) Total energy consumption (trillion Btu)


Wyoming     1     12,368.3 13,335.4 967.1 7,158.3 7,718.0 559.7
North Dakota     2     4,677.5 5,549.4 871.9 3,564.6 4,229.0 664.4
West Virginia     3     2,200.0 2,661.6 461.6 3,942.7 4,770.0 827.3
New Mexico     4     1,301.0 1,636.8 335.8 2,727.9 3,432.0 704.1
Alaska     5     1,099.3 1,928.8 829.5 804.2 1,411.0 606.8
Oklahoma     6     800.4 1,233.5 433.1 3,167.2 4,881.0 1,713.8
Montana     7     522.5 932.8 410.3 558.5 997.0 438.5
Pennsylvania     8     392.5 702.0 309.5 5,024.8 8,987.0 3,962.2
Colorado     9     370.0 635.9 265.9 2,130.8 3,662.0 1,531.2
Texas     10     206.2 704.3 498.1 5,978.2 20,421.0 14,442.8
United States*     2.7 307.8 305.2 873.0 101,038.0 100,165.0


For more information, a detailed methodology, and complete results, you can find the original report on Commodity.com’s website: https://commodity.com/blog/states-export-most-energy/