New Articles

Cities With the Biggest Increase in Construction Jobs

construction

Cities With the Biggest Increase in Construction Jobs

While the potential for trillions of dollars of new infrastructure spending looms on the horizon, America’s construction industry is struggling to even keep pace with current demand for new homes, businesses, roads, and bridges. A shortage of supplies and employees has created ongoing challenges for construction firms and their customers.

“The home building industry faces a major shortage of skilled workers. This persistent challenge endangers the affordability and availability of housing and hinders a robust economic recovery,” said Ed Brady, president and CEO of the Home Builders Institute (HBI), which recently released a report detailing the extent of the worker shortage. At the start of 2021, 60% of builders were experiencing a labor shortage, and the industry was in need of more than 300,000 additional workers, according to HBI. Even more recently, the trade association Associated Builders and Contractors estimated 430,000 additional workers would need to be hired in 2021.

While the construction labor shortage has been exacerbated by recent economic conditions, it is a trend that predates the COVID-19 pandemic. The longer-term issue stems from a decades-long decline in trade education and a lack of interest among younger workers, many of whom perceive employment in the construction industry as a last resort.

The construction labor shortage is most severe for framing crews and carpenters, where about 25% of firms reported a serious shortage and nearly another 50% reported moderate labor shortages, the HBI report noted. Other trades facing significant labor shortages included bricklayers, masons, concrete workers, painters, and plumbers.

Despite short- and long-term labor shortages at the national level, states where population growth has been hottest are also where construction hiring has boomed in recent years. From 2015 to 2020, the Bureau of Labor Statistics recorded about 35% growth in construction employment in Idaho and Nevada, as well as about 30% growth in Florida, Arizona, Oregon, and North Carolina. In contrast, states in the Mid-Atlantic and Midwest regions have seen construction jobs stagnate or even decline over the past five years.

To find which metropolitan areas have added the most construction jobs over the same time period, researchers at Construction Coverage analyzed BLS data between 2015 and 2020, calculated the percentage change in construction employment, and ranked all metros of 100,000 residents or more based on that growth.

Here are the large metropolitan areas that added the most construction jobs over the past five years.

Metro Rank   Percentage change in construction employment (2015–2020) Percentage change in total employment (2015–2020) Total change in construction employment (2015–2020) Total construction employment (2020) Median annual wage for construction workers (2020)


Sacramento–Roseville–Arden-Arcade, CA    1     48.8% 10.7% 17,510 53,370 $55,250
Charlotte-Concord-Gastonia, NC-SC    2     37.9% 8.7% 15,270 55,580 $41,270
Las Vegas-Henderson-Paradise, NV    3     34.1% No significant change 13,320 52,340 $49,140
Phoenix-Mesa-Scottsdale, AZ    4     33.3% 12.4% 25,900 103,640 $47,030
Tampa-St. Petersburg-Clearwater, FL    5     32.2% 7.2% 14,570 59,860 $38,870
Nashville-Davidson–Murfreesboro–Franklin, TN    6     31.3% 9.3% 8,210 34,470 $41,810
Portland-Vancouver-Hillsboro, OR-WA    7     30.9% 4.9% 13,360 56,580 $59,390
Jacksonville, FL    8     29.8% 9.8% 7,800 33,970 $38,450
Riverside-San Bernardino-Ontario, CA    9     29.6% 13.7% 19,100 83,650 $52,580
Miami-Fort Lauderdale-West Palm Beach, FL    10     28.5% 3.0% 23,080 103,950 $41,440
Salt Lake City, UT    11     27.2% 10.4% 8,370 39,130 $48,060
Orlando-Kissimmee-Sanford, FL    12     25.5% 6.6% 11,850 58,230 $39,670
Grand Rapids-Wyoming, MI    13     24.2% No significant change 3,770 19,320 $46,190
Raleigh, NC    14     22.1% 10.1% 5,100 28,180 $43,340
Indianapolis-Carmel-Anderson, IN    15     20.1% 2.7% 6,950 41,580 $48,360
United States    –     8.4% 0.9% 460,010 5,937,830 $48,610


For more information, a detailed methodology, and complete results, you can find the original report on Construction Coverage’s website: https://constructioncoverage.com/research/cities-with-biggest-increase-in-construction-jobs-2021

construction

The Best-Paying Construction Jobs

It’s already been a busy year for construction, thanks to surges in new housing development and renovations, as well as changes to businesses brought on by the COVID-19 pandemic. These factors will likely accelerate already strong growth projections for the industry made prior to 2020. According to the U.S. Bureau of Labor Statistics (BLS), construction employment was projected to grow at a faster pace than average between 2019 and 2029—adding 4% more jobs, compared to 3.7% for other industries. Among the jobs anticipated to be most in demand are solar photovoltaic installers (up 50.5%), tile and stone workers (up 8.6%), and electricians (up 8.4%).

Those and other construction occupations tend to be financially rewarding relative to the level of education required for entry. The vast majority of construction jobs require no formal education or a high school diploma, yet they pay $906 per week—nearly as much as the $938 median weekly earnings of someone with an associate’s degree from college. The median earnings for high school graduates is $781 a week, while those without a diploma make $619.

While construction workers are generally paid well, their paychecks vary widely depending on where they work. The West Coast (including Alaska and Hawaii), pockets in the Midwest, and several Northeast states all pay construction workers higher hourly wages than the rest of the country. Hawaii and Illinois, for example, have a median hourly wage above $34, while Alaska and Massachusetts are around $30 per hour. Meanwhile, several states across the South pay as low as $18 per hour for construction work.

The type of construction work is also a major factor in how well employees are paid. Many of the higher rates fall to areas of specialization, like elevator installers, boilermakers, and pile-driver operators. However, general construction supervisors, inspectors, and more common tradespeople like electricians can also earn higher pay rates.

To find the best-paying construction jobs, researchers at Construction Coverage analyzed the latest data from the BLS. Occupations were ranked according to their median hourly wage. Researchers also included median annual wages, total and projected 10-year employment numbers, and the percentage of workers that are self-employed for each occupation.

Here are the best-paying construction jobs in the United States.

Occupation Rank Median hourly wage Median annual wage Total employed nationally Projected 10-year employment growth Percentage of workers that are self-employed


Elevator and Escalator Installers and Repairers     1    $42.57 $88,540 24,730 +6.6% N/A
First-Line Supervisors of Construction Trades and Extraction Workers     2    $32.61 $67,840 614,080 +4.8% 8.0%
Boilermakers     3    $31.42 $65,360 14,020 +0.9% N/A
Pile Driver Operators     4    $30.47 $63,370 3,820 +4.4% 2.2%
Construction and Building Inspectors     5    $30.22 $62,860 113,770 +3.2% 6.8%
Tapers     6    $28.58 $59,450 16,320 -4.0% 17.8%
Electricians     7    $27.36 $56,900 656,510 +8.4% 5.0%
Rail-Track Laying and Maintenance Equipment Operators     8    $27.10 $56,370 17,590 +3.4% N/A
Plumbers, Pipefitters, and Steamfitters     9    $27.08 $56,330 417,440 +4.3% 8.3%
Brickmasons and Blockmasons     10    $26.48 $55,080 59,940 -6.4% 26.8%
United States     –    $23.37 $48,610 5,937,830 4.0% 14.9%


For more information, a detailed methodology, and complete results, you can find the original report on Construction Coverage’s website: https://constructioncoverage.com/research/best-paying-construction-jobs-2021

workplace injuries

Industries With the Highest Rates of Workplace Injuries

One of the concepts that the COVID-19 pandemic brought to the forefront of the public imagination is the idea of an “essential worker.” The pandemic highlighted that many professions are critical for allowing the rest of the economy and society to function properly, especially in a time of crisis. Some essential professionals like health workers and teachers were already held in high regard, but COVID-19 put a new spotlight on workers in oft-overlooked industries like grocery, elder care, and shipping and logistics.

Of course, the reason why these professions have drawn attention is the fact that workers in these fields kept working despite higher risks of virus exposure in the course of doing their jobs. Early on in the pandemic, many people were easily able to transition to working remotely, while many others saw their jobs eliminated or hours reduced as a result of COVID-19’s economic shocks. But essential workers mostly continued working in-person, all the while confronting the greater possibility of contracting COVID-19.

These varying experiences of COVID-19 across professions reflect the larger fact that every job has different levels and types of risk inherent in the work. Professions that involve manual labor or interacting with tools and machinery tend to be among the most prone to injury and illness, but no job is perfectly safe. Fortunately, however, the U.S. has seen positive trends in reducing the number and severity of work-related injuries and illnesses in recent years.

According to data from the Bureau of Labor Statistics, the overall number of cases per 100 full-time workers has been cut nearly in half over the last two decades, from 5.0 in 2003 to 2.8 in 2019. And this is part of a much longer-running trend that began with the creation of the Occupational Safety and Health Administration in the early 1970s. When OSHA was created in 1971, the rate of injury and illness on the job was 11 per 100 workers, but that number has been on the decline ever since thanks to OSHA and other efforts to promote workplace safety.

Lower incidences of workplace injury and illness overall have come with a parallel reduction in the number of injuries and illnesses that inhibit the ability to work. In 2003, there were 1.5 cases per 100 workers that led to days away from work. That number dipped to 1.0 in 2011 and has remained at or below that level ever since.

Despite this progress overall, the risk profile across professions continues to vary, and the data suggest that these different risk levels are also closely correlated with income. In general, industries with lower median earnings tend to see more work-related illnesses or injuries, while industries with higher earnings tend to see fewer. This situation is likely to be exacerbated by COVID-19, as many essential professions or other jobs that have continued in-person also pay lower wages than the lower-risk white-collar jobs that were able to transition to virtual work.

To identify the industries with the highest rates of workplace injuries, researchers at Construction Coverage collected data from the Bureau of Labor Statistics, including each industry’s total number of cases per 100 workers, cases resulting in missed days or job transfer/restrictions, median wage, and total employment. Industries were ranked by the total number of cases per 100 workers.

Here are the industries with the highest rates of workplace injuries.

Industry
Rank
           Total  cases (per 100 workers)
Cases with days away from work (per 100 workers)
Cases with days of job transfer/restriction (per 100 workers)
Other cases (per 100 workers)
Median annual wage
Total employment
Couriers and messengers    1      8.1 3.3 2.8 2.1 $36,890 796,660
Air transportation    2      6.5 3.7 1.5 1.2 $62,480 498,830
Wood product manufacturing    3      6.1 1.8 1.7 2.6 $34,260 406,100
Performing arts, spectator sports, and related industries    4      6.0 1.4 1.9 2.7 $37,330 519,810
Nursing and residential care facilities    5      5.9 1.7 1.8 2.4 $30,370 3,351,090
Animal production and aquaculture    6      5.6 2.1 1.3 2.1 N/A N/A
Hospitals    7      5.5 1.3 0.9 3.3 $58,210 6,094,940
Crop production    8      5.3 1.4 1.6 2.2 N/A N/A
Support activities for agriculture and forestry    9      5.2 1.8 1.5 1.9 $26,430 382,330
Building material and garden equipment and supplies dealers    10      4.9 1.6 1.7 1.6 $29,830 1,311,670
Warehousing and storage    11      4.8 1.9 1.7 1.2 $36,170 1,214,230
General merchandise stores    12      4.6 1.2 1.6 1.8 $25,310 3,129,540
Fishing, hunting and trapping    13      4.6 2.3 N/A 1.5 N/A N/A
Primary metal manufacturing    14      4.4 1.2 1.5 1.7 $44,520 385,910
Beverage and tobacco product manufacturing    15      4.3 1.3 1.6 1.4 $38,680 282,110


*Incidence rates represent the number of injuries and illnesses per 100 full-time workers

For more information, a detailed methodology, and complete results, you can find the original report on Construction Coverage’s website: https://constructioncoverage.com/research/industries-with-highest-rates-of-workplace-injuries-2021

cities

Cities Most Dependent on Small Businesses

Small business is often held up as a key driver of the U.S. economy, and for good reason.

According to the U.S. Small Business Administration, small businesses account for 64 percent of net private-sector jobs created since 2005. Collectively, small enterprises employ around 60 million Americans, which represents nearly half of the private workforce in the U.S. Compared to larger firms, small businesses tend to be more nimble, which promotes competition and innovation in the economy. Additionally, small businesses help strengthen communities, and entrepreneurship is a common route through which immigrants assimilate into the social and economic life of the U.S.

But with fewer financial resources than larger firms, small businesses are especially vulnerable during economic downturns. Where large firms can more easily turn to banks or capital markets for an infusion of funding in tough times, small enterprises are more likely to respond by scaling back operations, letting go of employees, or closing altogether.

While the recession of 2008 and the slow recovery that followed were hard on all sectors of the economy, small businesses struggled even more than large firms. Thousands of small businesses failed in the wake of the recession. Many would-be small business owners decided not to take on the financial risk of starting a business during the weak economic recovery, and lenders proved more risk-averse in financing new businesses as well. As a result, industry concentration in large firms has increased over the last decade, and employment growth at large businesses has far outpaced that of small businesses over the same period.

Today, COVID-19 is creating more difficulties for small businesses. Some of the industry sectors that tend to be most densely populated with small firms have also been the sectors most affected by shifts in consumer behavior and government restrictions meant to slow the spread of the virus. Notably, accommodation, food services, and retail businesses together employ nearly a quarter of all small business employees. But with more people staying at home, these firms—many of which have already been forced to close—face dire circumstances.

The continued success of small business matters more for some locations than others. Rural states in the Upper Plains, like Wyoming and Montana, and in New England, like Vermont, have a much higher share of small business employees in the workforce than other states. Because these areas tend to have few large employers, failures in the small business sector could create job shortages and prolonged economic hardship in these areas.

At the metro level, some of the areas most dependent on small businesses are in the aforementioned rural states, but other factors are at play as well. Some are Rust Belt communities where employment was formerly dominated by now-offshored manufacturing operations, leaving smaller businesses to generate most of the economic activity. Others have strong startup ecosystems that encourage entrepreneurs to create new firms.

To identify the locations most dependent on small businesses, researchers at Construction Coverage used U.S. Census data to find the percentage of employees in each metro employed at small businesses, defined as those firms having fewer than 500 employees.

Here are the large U.S. metropolitan areas most dependent on small businesses.

Metro Rank   Percentage of employees at small businesses  Total number of small business employees  Total number of small businesses   Percentage of total payroll paid by small businesses   Total small business payroll per employee  

Total large-firm payroll per employee

New Orleans-Metairie, LA     1      53.65% 265,378 23,960 49.26% $43,602 $51,989
Miami-Fort Lauderdale-West Palm Beach, FL     2      53.50% 1,184,791 167,326 48.27% $43,392 $53,498
Oklahoma City, OK     3      53.32% 269,939 28,210 48.62% $40,574 $48,974
Providence-Warwick, RI-MA     4      52.36% 333,667 33,162 47.72% $43,098 $51,898
New York-Newark-Jersey City, NY-NJ-PA     5      51.98% 4,356,853 499,998 41.10% $56,279 $87,294
Los Angeles-Long Beach-Anaheim, CA     6      51.93% 2,764,749 313,657 46.12% $52,115 $65,764
Portland-Vancouver-Hillsboro, OR-WA     7      51.41% 538,511 55,667 41.79% $45,280 $66,725
Buffalo-Cheektowaga-Niagara Falls, NY     8      50.93% 245,969 21,132 46.54% $40,162 $47,880
Grand Rapids-Wyoming, MI     9      50.36% 253,133 19,092 48.50% $43,895 $47,283
San Francisco-Oakland-Hayward, CA     10      50.31% 1,090,428 104,849 37.81% $67,798 $112,911
San Diego-Carlsbad, CA     11      50.06% 634,069 69,216 42.59% $49,023 $66,233
Washington-Arlington-Alexandria, DC-VA-MD-WV     12      49.64% 1,327,443 116,882 45.11% $60,027 $71,999
Sacramento–Roseville–Arden-Arcade, CA     13      49.45% 367,438 38,300 41.78% $45,280 $61,702
Austin-Round Rock, TX     14      49.39% 413,394 40,661 42.47% $48,145 $63,651
Baltimore-Columbia-Towson, MD     15      48.53% 573,447 52,387 42.56% $48,700 $61,994
United States     –      47.09% 60,556,081 5,976,761 40.32% $44,777 $58,996


For more information, a detailed methodology, and complete results, you can find the original report on Construction Coverage’s website: https://constructioncoverage.com/research/cities-most-dependent-on-small-businesses

compaction Construction workers

Cities With the Most Construction Workers

The COVID-19 pandemic has had sweeping impacts on the economy and virtually every industry sector. While the construction industry has weathered the storm better than some hard-hit industries—such as leisure and hospitality—construction is facing some unique challenges. Construction companies are currently contending with project cancellations and delays, supply chain disruptions, and COVID infections among workers. Some parts of the country are more reliant on the construction industry than others, and some are facing worse COVID outbreaks and more stringent business restrictions, meaning the pandemic’s impact on the construction industry has had differential geographic impacts. While construction jobs account for 5.2 percent of all jobs nationally (according to the Bureau of Labor Statistics), some cities rely more heavily on the construction industry for employment.

Historically, construction employment tends to follow the business cycle, fluctuating with economic expansions and recessions. During the Great Recession that lasted from late-2007 to mid-2009, construction employment fell by 20 percent and then continued to fall until early 2010. It then steadily increased until early 2020. Along with overall employment, employment in the construction industry fell sharply in the spring during the early stages of the pandemic. It started rebounding in May but is still below pre-pandemic levels. Compared to a year ago, construction employment is currently down 2.4 percent.

Construction employment varies substantially on a geographic level. Some cities and states are much more reliant on the construction industry than others, with some areas employing large shares of construction workers. The West tends to depend more heavily on the construction industry while the Midwest and Northeast have lower shares of construction employment. At the state level, Wyoming and Utah boast the largest shares of employment in construction, at 8.5 and 7.6 percent, respectively. Connecticut has the lowest share of employment in construction in the country at just 3.6 percent.

Compared to a year ago, most states experienced declines in construction employment. Down 25 percent from the end of 2019, Vermont had the largest drop in construction employment out of all states. Some states, including Virginia and Missouri, saw employment in construction increase from 2019. Construction employment grew by 5.7 percent in Virginia and by 8 percent in Missouri.

To find the metros with the most construction workers, researchers at Construction Coverage analyzed the latest data from the Bureau of Labor Statistics. The researchers ranked metro areas according to the share of employment in construction. Researchers also calculated the construction employment share compared to the national average, the total number of construction employees, and the year-over-year change in construction employment.

Here are the metropolitan areas with the most construction workers.

Metro Rank Share of employment in construction Share of employment in construction (compared to average) Total number of construction employees Year-over-year change in construction employment


Lake Charles, LA     1 19.0% +267.9% 18,600 -16.2%
Baton Rouge, LA     2 11.8% +129.3% 46,800 -3.7%
Vallejo, CA     3 9.7% +87.4% 12,800 -3.8%
Santa Rosa-Petaluma, CA     4 8.6% +65.9% 16,600 -5.1%
Coeur d’Alene, ID     5 8.0% +54.3% 5,200 -13.3%
Salem, OR     6 7.7% +49.5% 12,300 -1.6%
Tacoma-Lakewood, WA     7 7.5% +44.5% 23,600 -6.7%
Casper, WY     8 7.5% +45.5% 2,800 0.0%
Reno, NV     9 7.4% +43.3% 17,800 -2.7%
Riverside-San Bernardino-Ontario, CA     10 7.3% +41.8% 107,300 +1.9%
Las Vegas-Henderson-Paradise, NV     11 7.3% +41.2% 68,800 -6.6%
Houston-The Woodlands-Sugar Land, TX     12 7.2% +39.5% 220,000 -9.3%
Orlando-Kissimmee-Sanford, FL     13 7.0% +35.5% 85,500 -2.8%
San Rafael, CA     14 7.0% +36.1% 7,600 -2.6%
Anaheim-Santa Ana-Irvine, CA     15 6.9% +33.2% 107,200 +1.6%
United States     – 5.2% N/A 7,430,000 -2.4%


For more information, a detailed methodology, and complete results, you can find the original report on Construction Coverage’s website: https://constructioncoverage.com/research/cities-with-the-most-construction-jobs

construction

Cities With the Most Women in Construction

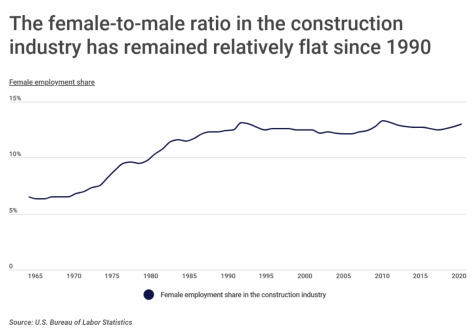
Construction has long been a male-dominated field. According to data from the Bureau of Labor Statistics, only about 13 percent of payroll employees in the construction industry are women—a number that has remained relatively stagnant since the 1990s. When also taking into account self-employed workers, the proportion is even lower, at just 10.3 percent. Despite the gender gap in employment, some job functions and locations offer better opportunities for women seeking a career in the construction industry.

Nationwide, there are over 1.1 million women working in construction, compared to 9.9 million men. In addition to differences in total employment, men and women tend to fill different occupations within the industry. According to the Bureau of Labor Statistics, women who work in construction are most likely to work in office or administrative positions. By contrast, men have a much higher representation in roles related to finance, transportation, construction, extraction, and maintenance.

A major benefit for women in the construction industry is that they tend to command higher wages than female workers in other fields. The median full-time wage for women in construction is $46,808 per year, compared to $43,394 for female workers across all industries. Interestingly, the opposite is true for men in construction, who generally earn less than the typical male worker. In addition, men and women in the construction industry report relatively equal pay. While the national gender pay gap across all industries is 19 percent, the gender pay gap in construction is only 3.7 percent.

Although only 10.3 percent of workers in the construction industry are women, some parts of the country have much stronger female representation. To find which cities have the most women in construction, researchers at Construction Coverage analyzed employment data from the U.S. Census Bureau’s 2019 American Community Survey 1-Year Estimates. Researchers ranked cities based on the female employment share in the construction industry. In the final rankings, cities were categorized by population size: small (100,000–149,999), midsize (150,000–349,999), and large (350,000 or more).

Most of the cities on the list are concentrated in the South or the West, with some representation in the Midwest and little in the Northeast.

Here are the cities with the most women in construction.

City Rank Female employment share in the construction industry Total female employment in the construction industry Total male employment in the construction industry Median earnings for full-time workers in the construction industry
Minneapolis, MN     1     19.1%     1,298     5,495     $54,521
Seattle, WA     2     17.6%     2,697     12,664     $70,966
San Francisco, CA     3     17.0%     2,985     14,590     $70,711
Washington, DC     4     16.1%     1,831     9,517     $52,035
Virginia Beach, VA     5     15.5%     2,187     11,891     $52,325
Colorado Springs, CO     6     15.4%     2,743     15,037     $55,363
Atlanta, GA     7     14.6%     885     5,158     $44,346
El Paso, TX     8     14.1%     2,968     18,044     $35,710
Charlotte, NC    9     13.6%     4,747     30,113     $36,988
Wichita, KS    10     13.4%     1,855     12,011     $40,067
San Diego, CA    11     13.3%     4,270     27,919     $53,990
Tampa, FL    12     13.3%     2,015     13,135     $49,938
Kansas City, MO   13     13.1%     1,760     11,630     $41,742
Portland, OR    14     13.0%     1,897     12,703     $63,892
Baltimore, MD    15     12.3%     1,577     11,201      $50,740
Louisville, KY    16     12.1%     1,932     13,971     $46,560
New Orleans, LA    17     11.9%     1,143      8,433     $37,300
Austin, TX    18     11.8%     4,650     34,688     $40,595
Denver, CO    19     11.8%     3,636     27,277     $49,437
Columbus, OH   20     11.7%      2,395      18,139     $40,913
United States     10.3%     1,136,672     9,900,222     $48,307


For more information, a detailed methodology, and complete results, you can find the original report on Construction Coverage’s website: https://constructioncoverage.com/research/cities-with-the-most-women-in-construction-2020

oil prices

U.S. States and Metros Hit the Hardest by the Drop in Oil Prices

The COVID-19 pandemic has sent the world economy into turmoil as lockdowns around the world have caused economic activity to grind to a halt. The demand for oil has crashed in the wake of the growing pandemic, sending oil prices diving and even dipping below $0 per barrel. According to the most recent data from the U.S. Census Bureau, the U.S. employs close to 130,000 people in the oil and gas extraction industry. Many of these workers now face uncertain employment.

Bureau of Labor Statistics (BLS) data from the last two decades shows that employment in the oil and gas sector tends to rise and fall with crude oil prices. Price drops in 2014 resulting from oil surpluses caused the oil and gas sector to shed roughly a third of its workforce. Today, the pandemic combined with a lack of storage capacity for excess oil have caused the price to fall sharply again—a trend that threatens thousands of jobs.

The concentration of oil and gas extraction workers varies widely by location. At the state level, Oklahoma and Wyoming have the highest concentrations of workers in oil and gas extraction at 7.7 and 6.7 times the national average respectively. Texas, with a relative concentration of 5.8 times the national average, boasts the largest number of total oil and gas workers of any state. Many states such as Hawaii, Maine, and Rhode Island don’t produce oil or natural gas and have no employees reported by the Census Bureau.

To find the metropolitan areas hit hardest by the drop in oil prices, researchers at Construction Coverage used data from the U.S. Census Bureau and the Bureau of Economic Analysis. The researchers ranked metro areas according to the relative concentration of employment in the oil and gas extraction industry. Researchers also looked at the total number of oil and gas extraction workers, the median earnings for those workers, and cost of living. To improve relevance and accuracy, only metropolitan areas with at least 100,000 people were included in the analysis.

Here are the 25 major U.S. metropolitan areas with the highest concentrations of oil and gas workers:

For more information, a detailed methodology, and complete results for all major metros and U.S. states, you can find the original report on Construction Coverage’s website: https://constructioncoverage.com/research/cities-hit-hardest-by-drop-in-oil-prices

Report republished with permission

small businesses

U.S. Metros With the Most Small Businesses Per Capita

Small businesses across the United States face dire circumstances following the COVID-19 outbreak. While each individual small business might seem inconsequential to the broader economy, in aggregate, these firms are critical to the country’s financial well-being.

According to the most recent data from the U.S. Census Bureau, small businesses with fewer than 50 employees makeup approximately 95 percent of American business establishments and employ 40 percent of private sector workers. These 7.4 million small businesses (or 2.27 per 100 residents) also account for roughly a third of total private sector payroll.

Unfortunately, research shows that small businesses and their workers are particularly vulnerable during recessions and other periods of economic hardship. A recent survey conducted by the New York Fed found that even prior to the pandemic, 64 percent of small businesses faced financial challenges in the preceding 12 months. The same survey reported that a two-month loss of revenue would cause 86 percent of firms to take a serious financial action, such as using the owner’s personal savings, taking out a loan, or cutting staff salaries.

Moreover, small businesses in some industries have a larger economic impact than others. Among small businesses with fewer than 50 employees, those in accommodation, food services, and retail trade—coincidentally, the sectors hit hardest by COVID-19—employ the most workers. These industries, combined, account for more than 16 million employees and $362 billion in annual payroll.

Like the businesses themselves, small business employees are also more financially vulnerable than their large-firm counterparts. Data from the Bureau of Labor Statistics shows that fewer small business employees have access to retirement benefits, healthcare benefits, paid sick leave, life insurance, or disability insurance. Troublingly, only half of employees in small businesses have health insurance through their company and only two-thirds have paid sick leave.

While small businesses are a critical component of the national economy, some parts of the country depend more on small businesses than others. To find the metropolitan areas with the most small businesses, researchers at Construction Coverage, a review website for workers’ compensation insurance and construction software, analyzed the latest data from the U.S. Census Bureau. The researchers ranked each location according to the number of small businesses per 100 residents. Researchers also included statistics on the total number of small businesses, the number of retail, accommodation, and food service businesses, and the share of workers who are self-employed. For the analysis, small businesses were defined as those employing fewer than 50 workers.

To improve relevance, only metropolitan areas with at least 100,000 people were included in the analysis. Additionally, locations were grouped into the following cohorts based on population size: large metros (1,000,000 residents or more), midsize metros (350,000-999,999 residents), and small metros (less than 350,000 residents).

Here are the large metropolitan areas with the most small businesses per capita:

For more information, a detailed methodology, and complete results, you can find the original report on Construction Coverage’s website: https://constructioncoverage.com/research/cities-with-the-most-small-businesses