New Articles

U.S. Import Volume Growth: Is Global Supply Chain Performance Bouncing Back?

intermodal cargo shipping container import logistics chain port containers

U.S. Import Volume Growth: Is Global Supply Chain Performance Bouncing Back?

Amidst renewed whisperings of an impending recession in the second half of 2023 and the possibility of a debt default by the U.S. government that could trigger unemployment and surging interest rates, importers and logistics service providers (LSPs) are bracing for a potential hard landing. On balance, however, there are signs that a number of the challenges to global supply chain performance in 2023 are abating.

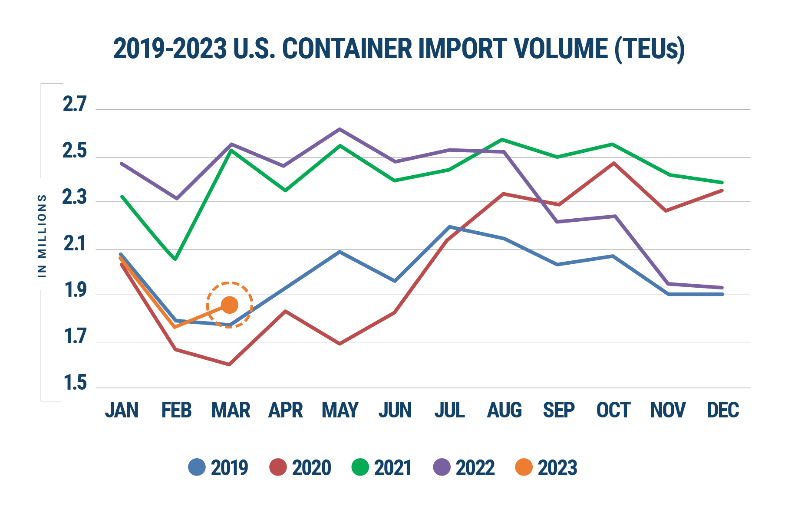
BIG GAINS IN IMPORT VOLUMES 

Partly driven by a spike in imports from China, U.S. container import volumes increased significantly in April 2023, rising 9% from March 2023 (Figure 1). Although container volume was down 17.8% from April 2022, imports were up 5.3% from pre-pandemic April 2019 and are continuing to track to 2019 levels—an encouraging trend.

Figure 1: U.S. Container Import Volume Year-over-Year Comparison

Source: Descartes Datamyne™

In a dramatic reversal of its downward trend, Chinese imports into the U.S. increased 26.7% in April 2023 compared to March volumes—representing 82% of the total volume increase from the top 10 countries importing into the U.S—although still down 26% from the August 2022 high. Compared to March 2023, April import volumes from Hong Kong (24.4%), Taiwan (19.3%), and Vietnam (13.8%) also increased significantly. In April 2023, China represented 36.8% of the total U.S. box imports, an increase of 5.2% from March, but still 4.7% below the high of 41.5% in February 2022. 

PORT PERFORMANCE IMPROVING 

In April 2023, U.S. container import volume at the top 10 ports increased 167,174 TEUs from March levels, with the Port of New York/New Jersey showing the greatest overall container volume increase (54,466 TEUs), followed by the Port of Savannah (24,923 TEUs). Given that the dramatic increase of Chinese imports in April should have favored West Coast ports, this growth pattern is somewhat counterintuitive. 

Notably, despite the increased activity, port delays declined significantly at all of the top ports (Figure 2). Signaling that global supply chain challenges are subsiding, port transit times were at their lowest level since 2021.

Figure 2: Monthly Average Transit Delays (in days) for the Top 10 Ports 

Source: Descartes Datamyne™

Note: Descartes’ definition of port transit delay is the difference as measured in days between the Estimated Arrival Date, which is initially declared on the bill of lading, and the date when Descartes receives the CBP-processed bill of lading.

CHALLENGES EASING

Importers and LSPs will be relieved that the two sides in the International Longshore and Warehouse Union (ILWU) and Pacific Maritime Association (PMA) negotiations are inching towards a new contract. Talks have been dragging on since May 2022 (the contract expired July 1, 2022) but PMA and the union have reached agreement on “certain key issues.” However, PMA commented that several important issues remain unresolved and work actions led by ILWU Local 13 at the Ports of Los Angeles and Long Beach continue to disrupt some operations at key marine terminals.

While some major shippers have been diverting cargo from the West Coast to ports on the East Coast and Gulf of Mexico to avoid potential work stoppages, there has been no serious impact on container processing, as has occurred in the past. The final resolution of the contract could bring some Asia-originating containers that had shifted to rival ports back to major California ports to take advantage of the shorter transit times.

While energy prices are generally moving in the right direction, fuel costs remain elevated, exerting continued pressure on the transportation budgets of importers and LSPs. The price of gasoline—a significant contributor to high inflation rates—increased slightly to $3.60/gallon but was down $0.58/gallon from the same time in 2022, according to the U.S. Energy Information Administration. 

Diesel costs also fell slightly to $4.02/gallon, a $1.49/gallon drop from April 2022. While declining fuel costs is always good news for logistics and supply chain companies, gasoline and diesel prices are likely to remain elevated for the foreseeable due to the disruption of global energy markets caused by the war in Ukraine and follow-on sanctions against Russia.

MANAGING SUPPLY CHAIN RISK

Although recent developments appear to indicate an easing of supply chain turbulence, importers and LSPs should keep an eye on several factors and ongoing issues that could cause further disruptions, tailoring their logistics and supply chain strategies accordingly to mitigate risk and promote financial stability.

1. Union issues and labor laws:

Logistics companies should closely monitor the progress of the IWLU-PMA contract negotiations. Progress is tediously slow but movement in either direction will impact port performance and the ability of importers to efficiently move their goods where they need to go. In addition, California’s AB5 legislation has the potential to cause more disruption at California’s port operations.

2. Port activity:

Importers and LSPs need to keep a close eye on import volumes and port transit times. Recent U.S. container imports are continuing to align with 2019 volumes but, if monthly TEU volumes surge to between 2.4M and 2.6M, as witnessed during the pandemic, ports and inland logistics would be under significant strain. 

Logistics companies should continue to seek out less congested transportation lanes, including smaller ports, to improve supply chain velocity and reliability. Evaluating alternative transportation lanes into the U.S., including entry through northern and southern borders and inland ports, is also a smart strategy to allay risk.

If port transit times decrease, as they did in April, it’s an indication that the efficiency of global supply chain capabilities has improved or, alternatively, that the demand for goods and logistics services is declining. Either way, pressure on the ports is relieved—good news for logistics-oriented companies.

3. Russia/Ukraine war and inflation

Importers and LSPs should monitor the ongoing impact of the Russia/Ukraine conflict on their logistics costs and capacity constraints, while ensuring that their key trading partners are not on sanctions lists. 

On the economic front, the latest Consumer Price Index report available (March 2023) showed a continuing decline in inflation, but the inflation rate remains elevated. Fuel prices—inextricably linked to inflation and a major component of logistics companies’ operational costs—should be monitored closely. Given that fuel prices will remain elevated indefinitely due to the war, logistics companies should evaluate ways to increase the fuel efficiency of their fleets, such as route optimization software or alternative-fuel vehicles. 

4. Ongoing pandemic impacts

While WHO recently declared that Covid-19 no longer represents a global health emergency—and the U.S. followed suit, terminating its federal COVID-19 Public Health Emergency act—the pandemic continues to impact global supply chain performance, especially in China. In fact, a 2023 analyst report declared that sourcing from Chinese manufacturers is tied to the largest supply chain risks; the possibility of delays and cancellations from Chinese suppliers is high due to the likelihood of COVID-19 localized disruptions in the country. 

FINAL THOUGHTS

The good news is that the pressure on supply chains and logistics operations is continuing to ease. However, we’re not in the clear just yet. Several challenges—from labor issues, elevated fuel prices, and economic uncertainty to the impact of the war in Ukraine and the lingering pandemic-related disruptions—continue to stress logistics operations. But by proactively monitoring key supply chain performance and economic indicators, importers and LSPs can address any capacity constraints or supply chain disruptions that may arise in the short term, while building long-term supply chain resilience to mitigate risk in the latter half of 2023 and beyond.


baltimore import mach electronic shipping route import 7LFreight Expands Instant Cargo Pricing and Booking for North American Forwarders Across Both Air and Trucking  import container descartes automation baltimore bridge container freight global trade

Descartes Releases April Global Shipping Report: March Volumes at Top West Coast Ports Increase Significantly

Descartes Systems Group, the global leader in uniting logistics-intensive businesses in commerce, released its April Global Shipping Report for logistics and supply chain professionals. U.S. container import volumes in March 2023 increased significantly from February 2023, largely driven by the Ports of Los Angeles and Long Beach, which was very counter intuitive, but kept the monthly trendline aligned with pre-pandemic 2019 volumes. Despite overall increases, port transit delays stabilized for all ports. Imports from China continued their downward trend and are almost 10% lower than their high in February 2022. The West Coast labor situation has still not been sorted out. The March update of the logistics metrics Descartes is tracking shows some consistency with pre-pandemic import volume seasonality but continues to point to challenging global supply chain performance in 2023.

March 2023 U.S. container import volumes increased 6.9% from February 2023 to 1,853,705 TEUs (see Figure 1). TEU volume was down 27.5% from March 2022, but up 4.2% from pre-pandemic March 2019. Two points to consider with the March numbers: 1) March has 31 days versus 28 for February and 2) With the Chinese Lunar New Year holiday occurring in January 2023, there still could be some impact on container import volumes in early March 2023.

Figure 1. U.S. Container Import Volume Year-over-Year Comparison

Chart, line chart Description automatically generated

Source: Descartes Datamyne™

“Container import volumes at the Ports of Los Angeles and Long Beach have been in decline, but in March they experienced significant increases (see Figure 2). 2023 continues to track 2019 volumes,” said Chris Jones, EVP Industry and Services at Descartes. “There was also good news in that the port transit delay times remained constant despite the significant volume increases.”

Figure 2: February to March Comparison of Import Volumes at Top 10 U.S. Ports

Source: Descartes Datamyne™

The March report is Descartes’ twenty-first installment since beginning its analysis in August 2021. To read past reports, learn more about the key economic and logistics factors driving the global shipping crisis, and review strategies to help address it in the near-, short- and long-term, visit Descartes’ Global Shipping Resource Center.

About Descartes

Descartes is the global leader in providing on-demand, software-as-a-service solutions focused on improving the productivity, performance and security of logistics-intensive businesses. Customers use our modular, software-as-a-service solutions to route, schedule, track and measure delivery resources; plan, allocate and execute shipments; rate, audit and pay transportation invoices; access global trade data; file customs and security documents for imports and exports; and complete numerous other logistics processes by participating in the world’s largest, collaborative multimodal logistics community. Our headquarters are in Waterloo, Ontario, Canada and we have offices and partners around the world.

intermodal cargo shipping container import logistics chain port containers

April Global Shipping Update: Import Volumes Increase Significantly at West Coast Ports

As the second quarter of 2023 unfolds, U.S. economic uncertainty continues to cast its shadow across the supply chain. While inflation appears to be decelerating, interest rates are still high and the political impasse over raising the federal debt ceiling is cause for concern, with the potential to send shock waves through global financial markets if the government defaults. In the midst of this volatile economic landscape, importers and logistics service providers (LSPs) continue to grapple with lingering supply chain challenges.

IMPORT VOLUMES REMAIN ON 2019 TRACK

Largely driven by activity at the Ports of Los Angeles and Long Beach, U.S. container import volumes increased significantly in March 2023, rising 6.9% from February 2023 to 1,853,705 TEUs (Figure 1) and keeping the monthly trendline aligned with pre-pandemic 2019 volumes. While volume was down compared to March 2022 (27.5% drop in TEU volume), imports were still up 4.2% from pre-pandemic March 2019.

When evaluating container import volumes, it’s worth noting that March 2023 numbers may be influenced by multiple factors, including the longer duration of the month (31 days vs. 28 days in February) and the potential lingering impact of January’s Chinese Lunar New Year holiday on early March import volumes.

Figure 1: U.S. Container Import Volume Year-over-Year Comparison

Source: Descartes Datamyne™

WEST COAST PORTS MAKE GAINS

Compared to February 2023, container import volumes for the Top 10 U.S. ports in March 2023 increased 98,379 TEUs (Figure 2). The West Coast ports made strong gains at the expense of the smaller ports, with the Port of Los Angeles experiencing the greatest overall container volume increase (30%), followed by the Port of Long Beach (25%).

The surge in volume at West Coast ports seems counterintuitive given that import volumes from China continued their downward trend—declining 7.4% from February 2023 and down 41.6% from the August 2022 high—and no country had a spike in commodities or exports to the U.S. from February to March. In addition, importers have likely been shifting freight away from the West Coast ports due to the uncertainty of the ongoing—and still unresolved—contract negotiations with the International Longshore and Warehouse Union (ILWU).

Figure 2: February to March Comparison of Import Volumes at Top 10 U.S. Ports

Source: Descartes Datamyne™

Notably, for the top 10 countries of origin, U.S. box import volume increased 2.5% (30,257 TEUs) in March, with Italy (50%), Thailand (39%) and South Korea (23%) experiencing the greatest percentage increases.

PORT TRANSIT DELAYS STABILIZE

Despite the increase in container import volume, port transit delays stabilized for all ports. Overall port transit delays in March 2023 were consistent with February 2023, with transit times at the major East and Gulf Coast ports remaining slightly lower than at major West Coast ports (Figure 3).

Figure 3: Monthly Average Transit Delays (in days) for the Top 10 Ports 

Note: Descartes’ definition of port transit delay is the difference as measured in days between the Estimated Arrival Date, which is initially declared on the bill of lading, and the date when Descartes receives the CBP-processed bill of lading.

ONGOING CHALLENGES HINDER TRADE FLOW

Despite the March data showing consistency with pre-pandemic import volume seasonality, lingering supply chain issues continue to hamper the efficient flow of goods. While the situation has improved since the start of the year, COVID continues to impact manufacturing supply chains, especially in China where companies are still dealing with the fallout of the country’s sudden zero-COVID exit this past December.

The ILWU contract negotiations continue to drag on, with the two sides seemingly no closer to bridging the gap on their disagreements. While there has been little impact on container processing to date, tensions are rising and there are calls to bring in the federal government to assist in the negotiations to resolve the issue.

On the regulatory front, California’s AB5 labor law remains a significant hurdle for logistics and transportation providers, with big implications for truckers at U.S. ports. With no resolution in sight, the potential for AB5 protests—akin to the demonstrations at the Port of Oakland last July that lead to a 28% drop in processed cargo containers—remains a concern.

With cuts to oil production and the war in Ukraine propelling energy prices higher, elevated gasoline costs—a significant contributor to high inflation rates—remain a challenge for importers and LSPs. Indeed, the price of gasoline increased slightly to $3.50 per gallon, according to the U.S. Energy Information Administration, although it was down $0.63 per gallon from the same time in 2022. 

And while the decline in the cost of diesel is good news—decreasing slightly to $4.11 per gallon and down $1.04 per gallon from March 2022—the cost of both fuels is likely to remain elevated for the foreseeable future given the disruption of global energy markets.

TIPS TO MITIGATE ONGOING SHIPPING DISRUPTIONS 

While the pressure on supply chains and logistics operations continues to ease, ongoing issues have the capacity to cause further disruptions as the second quarter of 2023 unfolds. To manage supply chain turbulence, importers and LSPs should review their supply chain strategies to identify opportunities to mitigate risk and moderate supply chain variability.  

In the short term, logistics companies should keep a close eye on ILWU contract negotiations, potential AB5-related port disruptions or decline in port container processing performance, and the spread of any new COVID variants, especially in China, that might impact manufacturing supply chains. 

Given the current economic unpredictability, importers and LSPs should focus on retaining existing supply chain resources, especially drivers. While wage increases are important, building trips to reduce stress and improve quality of life for drivers is equally important for increasing driver retention. 

To improve supply chain velocity and reliability, logistics companies should seek out less congested transportation lanes, including alternative entry lanes through northern and southern borders and inland ports. While total transit time is a valid consideration, supply chain predictability is especially valuable during times of economic uncertainty.

Thinking long-term, importers and LSPs should implement strategies to mitigate the risk of another logistics capacity crisis down the road. Companies may consider evaluating supplier and factory location density to minimize reliance on over-taxed trade lanes and geographical regions that have the potential for conflict. 

PARTING THOUGHTS

Overall, the March U.S. container import data points to less pressure on supply chains and logistics operations, with box import volumes tracking to 2019 levels and port transit delays remaining constant despite significant volume increases at West Coast ports. Yet, despite a degree of relief from the logistical challenges that choked operations during the height of the pandemic, several current issues may cause further disruptions and threaten global supply chain performance in 2023.

COVID continues to impact available supply chain and logistics resources and operations globally, increasing supply chain performance variability, while labor-related issues such as the unresolved ILWU contract negotiations and California’s AB5 law threaten West Coast port operations. 

Although the latest Consumer Price Index report (February 2023) shows a gradual decline in inflation, the rate is still high—driving a rolling recession and continued economic uncertainty in the U.S.; diesel prices continue to decline, but gas prices have risen slightly and remain elevated due to the Russia/Ukraine conflict. By monitoring these key economic and logistics factors closely, importers and LSPs can heighten supply chain resilience to mitigate risk and strengthen operational and financial performance moving forward.


baltimore import mach electronic shipping route import 7LFreight Expands Instant Cargo Pricing and Booking for North American Forwarders Across Both Air and Trucking  import container descartes automation baltimore bridge container freight global trade

Global Shipping Update: Modicum of Relief as Import Volumes Fall in Line with 2019 Levels

With the second quarter of 2023 on the horizon, importers and logistics service providers (LSPs) are wondering what lies ahead. The economic landscape is anything but predictable and there are conflicting opinions on what direction the economy will take. As for interest rates, they continue to decline but remain high. How is this uncertainty affecting supply chains? 

IMPORT VOLUMES ALIGNING WITH PRE-PANDEMIC LEVELS

U.S. container import volumes are declining and shifting back into line with 2019 volumes, to a time before the global pandemic prompted an explosion of ecommerce demand and imports soared to unforeseen heights. Indeed, import volumes saw a significant drop in February, decreasing 16.2% from January 2023 to 1,734,272 TEUs (see Figure 1). Compared to February 2022, TEU volume was down 25.0%—but was only 0.3% lower than pre-pandemic February 2019. 

While box imports continue to follow 2019 volumes, the volume decrease was the greatest of the last seven years, with the exception of February 2020 which marked the start of the pandemic (-17.9%). Notably, after an upward shift in January, Chinese imports into the U.S. returned to a downward trend in February 2023—a trend seen among all of the top countries of origin—with a volume decrease of 17.1% to 632,702 TEUs; China’s downward momentum represents a volume drop of 37.0% from the high in August 2022. 


It’s worth noting that February’s volumes may be influenced by multiple factors, including the shorter duration of the month (28 days vs. 31 days in January) and the impact of January’s Chinese Lunar New Year, which would see volumes materialize in late February and early March 2023. 

While overall U.S. container import volume for the Top 10 ports fell by 296,390 TEUs in February 2023 vs. January—all but the Port of Tacoma experienced declines—the volume share at top West Coast ports and top East and Gulf Coast ports remained relatively stable. West Coast ports decreased 2.8% while East and Gulf Coast ports increased 1.6% from January 2023. Compared to smaller ports, market share for the top 10 ports, however, has been steadily declining since mid-2022, with February 2023 representing the lowest share (82.8% of total volume) in the last year.

LESS VOLUME SHORTER WAIT TIMES

Despite fewer goods on the move, port transit delays increased for the top West, East and Gulf Coast ports, indicating ongoing supply chain turbulence. The West Coast ports are faring the worst, as transit times increased from 0.1 to 1.0 days in February compared to January 2023. With the exception of the Port of Long Beach, port transit delays for West Coast ports in February 2023 are now higher than in December 2022 (see Figure 2). 

Figure 2: Monthly Average Transit Delays (in days) for the Top 10 Ports 

Note: Descartes’ definition of port transit delay is the difference as measured in days between the Estimated Arrival Date, which is initially declared on the bill of lading, and the date when Descartes receives the CBP-processed bill of lading.

LINGERING DISRUPTIONS HINDERING FLOW OF GOODS

Whether it’s the long arm of COVID impacting manufacturing supply chains, or labor shortages and uncertainty complicating transport logistics, importers and LSPs continue to face barriers to supply chain performance. COVID continues to impact available supply chain and logistics resources and operations globally. China, in particular, has seen widespread COVID infections after rolling back its zero-COVID restrictions. While the loosening of the country’s pandemic policies was intended to minimize the longer-term disruptions to society and business, the Chinese population has little-to-no immunity and the impact of COVID on manufacturing supply chains could continue for quite some time. 

On the labor front, members of the International Longshore and Warehouse Union (ILWU) have been working without a contract since July 1, 2022. While ILWU and the Pacific Maritime Association (PMA) recently announced that they “continue to negotiate and remain hopeful of reaching a deal soon,” negotiations for a new collective bargaining agreement—encompassing more than 22,000 dockworkers at 29 West Coast ports—has been dragging on since May 2022. 

Adding further complexity to the uncertain labor situation, California’s new labor legislation AB5 remains a thorn in the side of the trucking industry, with the risk of future AB5-related stoppages at California ports. This continuing labor uncertainty may be a significant reason why import volumes are not shifting back to major California ports, despite their reduction in transit delay times over the last year plus. 

Importers and LSPs would be wise to keep close tabs on the progress of the ILWU contract negotiations and monitor the impact of AB5 on owner-operators serving California ports for potential disruption or any degradation of container processing performance at the ports.

KEEPING AN EYE ON INFLATION INTO Q2

Companies are watching inflation rates closely as 2023 unfolds. Although the Consumer Price Index (CPI) rose 0.4% in February—slightly less than January’s 0.5% increase—inflation fell to 6% year-over-year, inching in the right direction towards the Fed’s 2% target. However, supercore inflation—representing the cost of services—rose by 0.2% last month and is up almost 7% from a year ago. For example, package delivery costs have risen 14.4% in the last year, as of February 2023.

According to the U.S. Energy Information Association, gasoline costs, a significant contributor to high inflation rates, decreased slightly in February to $3.34/gallon and somewhat stabilized. Diesel costs were also down slightly to $4.29/gallon, nearing February 2022 prices. Although stabilized, fuel costs are likely to remain elevated due to the disruption of global energy markets caused by the war in Ukraine and subsequent sanctions against Russia.

MANAGING SUPPLY CHAIN RISK

With the myriad of challenges impacting supply chain performance, importers and LSPs should stay proactive in their approach to designing and executing their logistics and supply chain strategy. In the short term, evaluating and understanding the impact of inflation and the Russia/Ukraine conflict on logistics costs and capacity constraints is critical for clearing a path ahead, while making sure key trading partners are not on sanctions lists mitigates potential penalties and further delays.

In the near term, importers and LSPs should focus on improving supply chain velocity, reliability, and predictability by looking for less congested transportation lanes, including smaller ports, and evaluating alternative transportation lanes into the U.S. To allay the risk of another logistics capacity crisis in the long term, companies may consider evaluating supplier and factory location density to minimize reliance on over-taxed trade lanes and regions of the globe that have the potential for conflict. 

FINAL THOUGHTS

The February U.S. container import data demonstrates some consistency with pre-pandemic import volume seasonality and offers a measure of relief from the logistical challenges that have plagued operations over the past few years. Several factors, however, point to continuing challenges for global supply chain performance. 

Despite declining import volumes, port transit times increased at West, East, and Gulf Coast ports, while unresolved labor-related issues may be keeping importers from moving volume back to the West Coast. Compounding factors, including the COVID-related impact on China’s manufacturing capacity, inflation, and the war in Ukraine continue to put pressure on supply chains and logistics operations. By closely monitoring these factors and taking steps to build long-term supply chain resilience, importers and LSPs can mitigate risk, improve supply chain reliability and velocity, and shore up the bottom line moving forward.


vessel accident february

February Decrease Keeps 2023 U.S. Container Imports on 2019 Path

Descartes Systems Group, the global leader in uniting logistics-intensive businesses in commerce, released its March Global Shipping Report for logistics and supply chain professionals. The report shows February 2023 U.S. container imports decreased significantly from January 2023 but remained aligned with pre-pandemic 2019 volumes. Despite the reduction, port transit delays increased for the top West, East and Gulf Coast ports. Chinese imports followed the downward trend along with the rest of the top countries of origin. COVID continues to be a factor from ports of origin and the West Coast labor situation has still not been sorted out. The February update of the logistics metrics Descartes is tracking shows some consistency with pre-pandemic import volume seasonality but continues to point to challenging global supply chain performance in 2023.

February 2023 U.S. container import volumes decreased 16.2% from January 2023 to 1,734,272 TEUs (see Figure 1). Versus February 2022, TEU volume was down 25.0%, but only 0.3% lower than pre-pandemic February 2019. Two points to consider with the February numbers: 1) February has 28 days versus 31 for January and 2) With the Chinese Lunar New Year holiday occurring in January 2023, its impact on container import volumes would be seen in late February and early March 2023.

Figure 1. U.S. Container Import Volume Year-over-Year Comparison

Source: Descartes Datamyne™

“Examining imports from January and February in the previous six years, February 2023 volumes would have been expected to be significantly lower than January 2023 (see Figure 2),” said Chris Jones, EVP Industry at Descartes. “Declining container import volumes but rising port transit times demonstrate that, while 2023 volumes resemble 2019, global supply chain performance could remain uneven in 2023.”

Figure 2: January to February U.S. Container Import Volume Comparison


Source: Descartes Datamyne™

The March report is Descartes’ twentieth installment since beginning its analysis in August 2021. To read past reports, learn more about the key economic and logistics factors driving the global shipping crisis, and review strategies to help address it in the near-, short- and long-term, visit Descartes’ Global Shipping Resource Center.

About Descartes

Descartes (Nasdaq:DSGX) (TSX:DSG) is the global leader in providing on-demand, software-as-a-service solutions focused on improving the productivity, performance and security of logistics-intensive businesses. Customers use our modular, software-as-a-service solutions to route, schedule, track and measure delivery resources; plan, allocate and execute shipments; rate, audit and pay transportation invoices; access global trade data; file customs and security documents for imports and exports; and complete numerous other logistics processes by participating in the world’s largest, collaborative multimodal logistics community. Our headquarters are in Waterloo, Ontario, Canada and we have offices and partners around the world. Learn more at www.descartes.com, and connect with us on LinkedIn and Twitter.

solution transportation Venezuela, Colombia Open Binational Bridge to Boost Trade logistics third-party drummond arrive rockfarm businesses

2023 Transportation Outlook: 3 Trends to Prioritize for PERFORMANCE

Still recovering from the disruptions of the past three years, transportation organizations are bracing for continuing logistics and supply chain challenges in 2023. On the one hand, logistics service providers (LSPs) are experiencing some signs of relief as U.S. container imports have fallen back in line with pre-pandemic 2019 levels. On the flip side, some of the lingering challenges of the pandemic period continue to cause headaches for LSPs and for their shipper customers. 

Escalating costs of raw materials and finished goods—compounded by inflationary pressure, geopolitical upheaval, and near record low unemployment rates—are forcing companies to focus on cost containment as they try to minimize transportation costs through rate shopping, increasing transportation diversity, and strategic sourcing. Driver shortages also continue to wreak havoc with performance and profitability for transportation organizations. According to the American Trucking Associations, the industry’s current shortage of over 80,000 truck drivers could grow to more than 160,000 by 2030. The ongoing shortage of warehouse laborers also threatens to put further pressure on supply chains.

As the new year unfolds, what new global supply chain surprises, economic uncertainty, or industry upheaval might transportation providers face? And what steps do companies take to survive and, ultimately, thrive? While the past few years have taught businesses to expect the unexpected, transportation organizations can capitalize on three key trends in 2023 to help contain costs and foster resilience in the midst of ongoing and future supply chain challenges.

  • Customer DEMAND for SERVICE

The past several years have taken a severe toll on transportation service levels, damaging shippers’ relations with their customers. Today’s customers demand a higher level of service than ever before and have become much less forgiving when it comes to mediocre service experiences. While shippers will ask carriers and LSPs to “sharpen their pencils” on costs, they will also focus heavily on transportation performance, measure it much more precisely and often and even pay a slight premium for it. 

Shippers will also focus on carrier and LSP digital service capabilities as customers demand greater shipment visibility and the ability to control shipments in transit. Both B2C and B2B customers expect a granular level of real-time data about their shipments, with the ability to track goods through every stage of the transportation journey. Shippers must find a way to shine a light into the supply chain from the time an order is picked and packed in the warehouse to the time it is loaded onto the truck and in transit. In fact, real-time shipment visibility, ETAs, and electronic proof of delivery (POD) will become a base expectation in 2023 across all modes of transportation. 

  • The Opportunity of Sustainability 

A recent survey of more than 8,000 consumers across Europe, the U.S. and Canada, which examined consumer sentiment of sustainability practices around delivery operations, found many consumers prefer to buy from retailers with eco-friendly delivery options that simultaneously reduce environmental impact and transportation costs. In fact, more than 50% of those surveyed indicated they were “quite/very interested” in environmentally friendly delivery methods. 

Similarly, 54% of consumers indicated they would be willing to accept longer lead times for an eco-friendly delivery. Longer lead times provide more transportation options for companies to improve the efficiency of the delivery, typically resulting in a lower carbon footprint. In addition, 20% of respondents indicated they would pay more for a delivery from an environmentally-friendly company—a premium that can translate to millions in incremental revenue.

Providing sustainable delivery options is not only an important strategy for improving the customer experience and capturing a bigger share of the market, but also presents a financial opportunity to reduce transportation costs: eco-friendly deliveries are more efficient and cost-effective than traditional deliveries, in part because they drive delivery density. 

Plus, Environmental, Social and Governance (ESG) reporting requirements will see companies look to measure CO2 footprint across the supply chain and all modes of transportation. In the U.S., companies can leverage this information to take advantage of eco-based tax incentives, such as the plug-in vehicle credit, alternative fuel vehicle refueling property credit, and energy conservation subsidies. 

  • Building resilience through innovation

The fallout of the pandemic highlighted the vulnerability of transportation organizations and the need for innovation to promote agility, responsiveness, and resilience across the supply chain. A recent study examining how technology innovation is changing supply chain and logistics operations and executives’ plans for continued investment found that 59% of companies accelerated the pace of their innovation initiatives over the past two years; an even greater number (65%) plan to invest more heavily in technology for logistics innovation in the next two years.

Not surprisingly, a higher level of senior management importance placed on supply chain and logistics technology innovation goes hand-in-hand with better financial performance and lower employee turnover. Respondents who said that innovation was important to senior management were 20% more likely to be better financial performers and 13% more likely to experience lower employee turnover. 

In light of the value of supply chain innovation, embracing logistics digitization is a vital pathway forward for LSPs, carriers and shippers alike to enhance performance and profitability. When looking at the top digitization programs where companies were focusing their efforts, the study identified transportation processes (44%) as a key initiative. With the pressure of declining demand and excess capacity, the digital transformation of transportation processes will not only be critical to help contain costs, but also to enhance customer service and competitive differentiation. 

For example, digitization optimizes the customer experience by giving customers the ability to rate, quote, and book ocean shipments in seconds as opposed to waiting days. Digitization also provides shippers and carriers with the ability to determine, on demand, the status, location, and ETA of their freight, instead of having to pick up the phone or access a static view.

While efforts in innovation are accelerating, many companies are relatively early in their journey. Given that standing still is not a viable option, forward-thinking transportation organizations will leverage supply chain and logistics technology innovations to embed flexibility and agility into their transportation processes to better manage challenges.

The pressure on transportation providers to deliver high levels of performance at lower costs is real. Although advancing technology-enabled capabilities to be more agile and cost-effective while simultaneously optimizing the customer experience and reducing environmental impact is a big ask, companies that prioritize customer expectations, sustainability, and technologies for logistics innovation can drive greater resilience and adaptability into their transportation operations.

baltimore import mach electronic shipping route import 7LFreight Expands Instant Cargo Pricing and Booking for North American Forwarders Across Both Air and Trucking  import container descartes automation baltimore bridge container freight global trade

Global Shipping Update: Does 2023 Herald the Start of the Return to “Normal”?

As the new year unfolds, importers and logistics service providers (LSPs) are experiencing signs of relief from the logistical challenges of the past couple years, with U.S. container imports falling back in line with 2019 levels and port wait times continuing to decrease. On the flip side, key economic indicators, such as employment and inflation, paint a conflicting picture of their future impact on import volumes. Combined with COVID uncertainty, geopolitical upheaval, and ongoing U.S. West Coast labor issues, macroeconomic indicators point to further disruptions and challenging global supply chain performance in 2023.

IMPORT VOLUMES APPROACHING PRE-PANDEMIC LEVELS

When the global pandemic took hold in 2020, the “Stuff Economy” flourished, with consumer demand for apparel, kitchen appliances, sports equipment, and other retail goods soaring to unforeseen heights. U.S. imports accelerated in kind, precipitating a complex and unprecedented global supply chain crisis. Yet in the latter months of 2022, as record inflation took a bite out of disposable income and consumers put Covid in their rear-view mirror, shifting spending away from the purchase of goods towards services (e.g., travel, restaurants, entertainment), U.S. container imports began to decline.

Recent data shows December 2022 U.S. container imports receding to pre-pandemic 2019 levels. Indeed, December volumes declined 1.3% from November to 1,929,032 TEUs (see Figure 1). Although the holiday season in the second half of the month can adversely impact December import volumes, TEU volume was down 19.3% compared to December 2021—and sat just 1.3% higher than December 2019, before the pandemic forced lockdowns and sent the global supply chain into a tailspin.

Figure 1: U.S. Container Import Volume Year-over-Year Comparison

Source: Descartes Datamyne™

WEST COAST PORTS GAIN MARKET SHARE

While overall import volume decreased, half of the top 10 U.S. ports saw volume increases. The Port of Los Angles returned to its position as the top container import processing port, importing 349,493 TEUs and reporting the greatest increase, while the Ports of Houston and New York/New Jersey experienced the greatest drop in total import volume, declining 37,611 and 28,206 TEUs, respectively (see Figure 2).

Figure 2: November to December Comparison of Import Volumes at Top 10 U.S. Ports

Source: Descartes Datamyne™ 

In December 2022, top West Coast ports reversed their market share decline. Comparing the top five West Coast ports to the top five East and Gulf Coast ports in December vs. November, the total import container volume of West Coast ports grew to 38.1% in December. This gain represents a 1.2% increase from the previous month. In contrast, volume at East and Gulf Coast ports declined in December to 45.5%, down 1.7% from November. 

Despite this market share reversal, the top West Coast ports continued to experience container throughput shifts to other ports, including East and Gulf Coasts, from August through December 2022. However, with the exception of the Port of Houston, the top East and Gulf Ports are now operating below the peak volume levels that drove port congestion in 2021. 

PORT VELOCITY INCREASING

In good news for importers and LSPs, port delays continued to decline in December, especially for East Coast ports which saw a sizeable decrease and reported no double-digit wait times. Major West Coast ports are all now well below 10 days wait times and have somewhat stabilized. Much of this progress can be attributed to the continued reduction in volume that the majority of ports have experienced in the latter months of 2022. 

While wait times have made significant progress, schedule reliability still remains low when compared to pre-pandemic numbers. According to a recent Sea-Intelligence report, schedule reliability is almost 20% lower than in 2019.

CONTINUING IMPACT OF THE PANDEMIC: CHINA FOCUS

More than two years in, the spread of COVID subvariants continues to add uncertainty to the trajectory of the pandemic, impacting supply chains and global trade in unpredictable ways. While China relaxed its “zero-Covid” policy in early December in an effort to spur growth, the country’s exports continue to drop, with December’s 9.9% contraction the worst since February 2020, as China now grapples with the fallout, economic and otherwise, of the highly contagious Omicron variant.

With Lunar New Year—arguably the most important holiday of the year in China—beginning January 22, hundreds of millions of Chinese workers will be traveling in the midst of an Omicron wave. This has the potential to lead to localized lockdowns that could impede workers’ travel home to their manufacturing jobs, shortages of quarantine space in factory cities, and further disruptions in manufacturing and supply chain operations.

Of note, the downward trend of U.S. container imports from China continued in December, falling to 686,514 TEUs—down 0.5% from November and 31.9% from the 2022 high in August. Overall, China represented 35.4% of the total U.S. container imports, a decline of 6.1% from the high of 41.5% in February 2022. By comparison, U.S. imports showed strong growth from Japan and Thailand, increasing by 10.6% and 9.1%, respectively.

KEEP AN EYE ON LABOR AND INFLATION IN 2023

While members of the International Longshore and Warehouse Union (ILWU) have been working without a contract since July 1, 2022, the more pressing concern is California’s AB5 legislation which could lead to more port terminal shutdowns. This continuing labor uncertainty may be a significant reason why import volumes are not shifting back to major California ports, despite their improving situation. 

Importers and LSPs should watch the progress of the ILWU contract negotiations and monitor the impact of AB5 on owner-operators serving California ports for potential disruption or any degradation of port container processing performance.

Heading into 2023 with the threat of a global recession looming, key indicators offer a mixed view of the U.S. economy and, ultimately, demand for imports. Inflation remained high in December and, although both diesel and gas prices softened, they are likely to remain elevated for the foreseeable future due to the disruption of global energy markets driven by the war in the Ukraine and subsequent sanctions against Russia.

While inflation may be the only way to slow down the strong U.S. economy and, ultimately, help to alleviate existing global logistics capacity-related challenges, consumer spending remained relatively steady (up 0.1% in November) and the strong December job numbers—employment increased by 223,000 jobs and unemployment declined to record levels at 3.5%—are still contrary to the expected negative impact of high inflation figures and fuel prices. Of concern, strong employment numbers can put pressure on labor-intensive supply chain and logistics operations, impeding the ability to ensure adequate resources to meet customer demand. 

PARTING THOUGHTS

Overall, December U.S. container import data points to less pressure on supply chains and logistics operations. While pre-pandemic volume levels do offer a degree of relief from the logistical challenges that have plagued operations for the past few years, a number of issues may cause further disruptions this year. Outbreak risks from new Covid variants, geopolitical conflicts including Russia’s war in the Ukraine, ongoing labor negotiations at busy West Coast ports, and the threat of global recession are all on the radar of importers and LSPs. By keeping a close eye on these factors, in conjunction with key economic indicators—inflation rate, monthly BLS Jobs Report, FRED Inventory to Sales Ratio and FRED Personal Consumption Expenditure: Durable Goods—importers and LSPs can mitigate risk and heighten supply chain reliability to bolster their bottom line in the face of 2023’s uncertainties. 


prices New standards make trucks that carry shipments of export cargo and import cargo in international trade more fuel efficient.

Softening the Blow of High Fuel Prices

High fuel prices are on everyone’s mind, for global companies and consumers alike. OPEC+ recently agreed to deep cuts in oil production—2 million barrels per day (bpd) of output, equal to 2% of the global supply—curbing supply in an already tight market. Meanwhile, G7 leaders are considering a price cap on Russian oil, amidst concerns that Russia would ban all energy exports to any country implementing the price cap and crude oil prices could hit $125 a barrel as a result, according to a top commodities strategist. Adding fuel to the fire, the government sanctions imposed on Russia in response to its invasion of the Ukraine have disrupted the flow of complex global supply chains and continue to drive high oil prices. 

While recession concerns and a flare-up of China’s COVID-19 cases may temper rising oil prices, somewhat in response to the fear of reduced global demand, fuel prices remain elevated and volatile—and a potential impediment to profitability for logistics-oriented companies, including retailers, distributors, carriers, and logistics service providers. 

High Fuel Costs are a Company-wide Problem

Tackling the issue of high fuel costs is not solely the responsibility of the transportation department. In fact, many of the drivers of fuel consumption are dictated by other departments, such as sales, marketing, and customer service. As a result, companies need to look beyond their transportation and logistics teams to find solutions to rising costs.  

How customers are served is a major driver of fuel costs, from how regularly customers are serviced to minimum order quantities and delivery times. The finance department is also a critical piece of the equation, helping determine the risk/reward of employing various customer service strategies to mitigate the impact of high fuel costs. The good news is that, by taking an enterprise-wide approach to implementing strategic and tactical actions to optimize fuel consumption, companies can curb the impact of elevated fuel prices on their bottom line. 

3 Immediate Actions to Cut Fuel Costs

  1. Optimize performance of drivers and delivery vehicles. Are drivers in the habit of idling, driving aggressively, or straying from their scheduled route? When was the most recent fleet inspection? To reduce fuel consumption, encourage drivers to reduce speed, minimize idling, and stick to their prescribed routes; ensure vehicle engines are tuned and tires have adequate pressure to perform at their highest fuel efficiency.
  2. Add a surcharge for incremental fuel costs. More and more carriers and logistics-related companies are implementing fuel surcharges in response to rising fuel costs. While not popular among customers, fuel surcharges applied to new orders (or renegotiated in existing contracts) help mitigate the impact of high gas and diesel costs. Even a small rate increase can make a significant difference to a company’s bottom line over time.
  3. Offer customers delivery service choices. In order to keep their purchase costs from increasing, many customers are amenable to slower, less convenient delivery service. Accordingly, choose slower transportation modes and longer delivery lead times. Delay shipments to look for consolidation opportunities with other orders from the customer or customers nearby. Change TMS or route planning system optimization parameters to focus on selecting slower modes and reducing distance.

STRATEGIC AND TACTICAL ACTIONS THAT PAY OFF

  1. Optimize the logistics network. As customers come and go, buying patterns change, and product offerings grow, the efficiency of logistics networks deteriorates. Network optimization evaluates these types of changes and rebalances the network to reduce fuel consumption. Focus on service policies, operational strategies, and other ‘soft’ considerations initially to deliver quick results before revisiting brick and mortar ‘hard’ stuff to drive greater benefits.
  2. Re-bid carrier contracts. Existing contracts may have been written when fuel prices were much lower—and now significantly penalize the organization given today’s elevated prices. Take this opportunity to establish carrier contracts that prioritize fuel cost reduction.
  3. Steer customers and sales to delivery options that drive delivery density. Customers and sales reps may inadvertently make delivery appointment requests that decrease fleet efficiency and increase fuel consumption. Instead, provide customers with delivery appointment options that increase delivery density to help reduce distance traveled per stop, boost fuel efficiency, and lower fuel costs.
  4. Employ customer stratification. Customer stratification enables companies to strategically evaluate customers against the revenue generated and the cost to service them. As a result, customers can be mapped into a more cost-effective delivery strategy. For example, hybrid delivery combines dynamic and static delivery in a single planning model to support customer stratification, making the fleet more productive and minimizing fuel costs.
  5. Use dynamic delivery pricing. Not all customer deliveries cost the same. Instead, provide customers with unique delivery fees at the point of sale to better capture the real cost of the delivery. Customers can determine whether they prefer premium delivery times or a lower cost option. Many will select the latter, which will make delivery operations more productive, driving down fuel costs, driver hours, and more.
  6. Offer eco-friendly delivery options. The environment is becoming an increasingly important factor in consumers’ purchase decisions. By offering an eco-friendly delivery option, companies can reduce fuel consumption while shrinking their carbon footprint and building customer loyalty through a commitment to the environment. It’s a win-win-win approach: the planet benefits, the customer is happy, and the organization enjoys lower fuel and other delivery costs.    
  7. Implement optimized transportation or route planning solutions. Companies that are relying on legacy systems should evaluate the capabilities of more modern systems to uncover additional fuel savings opportunities and avoid the many manual workarounds typical of legacy technologies. Manual route planning processes, for example, are handcuffed by their inability to fully optimize appointment scheduling and delivery routes to minimize distance traveled and fuel consumption. By implementing an AI-driven, automated TMS or route planning solution to increase delivery density and optimize delivery efficiency, logistics-oriented companies can reap considerable cost savings.
  8.  Deploy telematics. Aggressive driving and excessive idling waste fuel and cause unnecessary vehicle wear and tear that can compromise fuel efficiency. A telematics solution captures critical driver operating data and vehicle data (e.g., real-time vehicle diagnostics, pre- and post-trip vehicle inspections) to identify poor driver performance and help companies maximize the potential of their fleets. Plus, companies can use real-time telematics data to enhance dispatch and tracking performance and capture ongoing operational data to spot trends and support continuous improvement.

High fuel costs can erode profit margins for companies already hobbled by global supply chain disruptions and labor shortages. The good news is that logistics-oriented organizations have numerous strategies, tactics, and tools at their disposal to mitigate the impact of fuel costs today and down the road.


coast

Top U.S. Port Analysis: A Tale of Two Coasts in 2022

The pandemic put global trade flows in play with significant changes in U.S. container import volumes, not only at the coast level, but at individual ports as well. Much has been made of the challenges that the top West Coast ports faced in 2021 and subsequent shifts in container volume from the West to East and Gulf Coast ports. September 2022’s significant overall decline in import volume of 12.4% versus August 2022 shows how other factors are unevenly impacting the coasts, such as an even larger decline in Chinese imports. The top East and Gulf Coast ports were much less affected by September’s volume decline (see Figure 1) but, unfortunately, they are still experiencing extended delays. 

Here’s how the top U.S. ports faired for the first nine months of 2022. 

Figure 1: TEU Volume at Top West versus East and Gulf Coast Ports

Source: Descartes Datamyne™

A closer look at fluctuating volumes.

Overall, in the first nine months of 2022, the top East and Gulf Coast ports benefited from the shift away from the top West Coast ports (see Figure 2). As of September 2022, the top East and Gulf Coast ports have 48.2% of the total container imports while the top West Coast ports’ share has dropped to 37% from a high of 47% in May of 2021.

Figure 2: Aggregate TEU Volume at Top West vs. East and Gulf Coast Ports

Source: Descartes Datamyne

On an individual basis, the ports of Houston, Charleston, and Long Beach had the greatest percentage growth in import container volume in 2022 (see Figure 3). The Port of Long Beach benefited from the growth and processed the greatest number of containers (3,874,481). While the Port of Los Angeles experienced a significant decline, it still processed the second highest number of containers (3,794,096), followed by the Ports of New York/New Jersey (3,394,935). Tacoma saw the greatest percentage decline followed by the Port of Los Angeles. In sheer numbers, the Port of Los Angeles saw the greatest decline in container volume (-512,401). 

Figure 3: Growth in TEU Volume at Top Ports: First 9 Months of 2022 vs. 2021

Source: Descartes Datamyne

The China factor.

Because it contributes a large percentage of U.S. imports, China has always been an important driver of overall container volume. However, while imports from China were marginally depressed during the spring lockdowns, other countries such as India and Germany helped to keep volumes high (see Figure 4). This can be seen particularly in September as U.S. import volumes from China were down 18.3% to 820,329 TEUs compared to August 2022, but overall U.S. import volume only declined 12.4%. As Chinese imports are heavily skewed to West Coast ports, they were the ones most impacted by the slowdown in China.  

Figure 4: Total U.S. and Chinese Import Volume (2022)

coast

Source: Descartes Datamyne™

Persistent port delays for the top East and Gulf Coast ports.

Throughout 2022, port delays have been fairly consistent with port volumes with one significant exception (see Figure 5). Most of the top West Coast ports saw their delays decline as their volumes declined. The top East and Gulf Coast ports had a relatively steady stream of imports and their wait times only declined slightly. The exception to all of this has been the Port of Long Beach which had a 10% increase in container volume, but also saw a 59% decrease in wait time. 

Figure 5: Monthly Average Delays (in days) at Top 10 Ports 

coast

Source: Descartes Datamyne™

Note: Descartes’ definition of port delay is the difference as measured in days between the Estimated Arrival Date, which is initially declared on the bill of lading, and the date when Descartes receives the CBP-processed bill of lading.

External factors impacting remainder of 2022. 

The continuing labor situation may be a factor that has been keeping most West Coast ports from recovering some of their volume in 2022. The International Longshore and Warehouse Union (ILWU) contract expired on July 1 and remains ongoing, though there has been no impact on container processing as has been the case in the past. California law AB5 also became a significant issue in 2022. Currently, no resolution is in sight and there is a risk that more AB5-related stoppages could occur at California ports in the future, causing greater disruption. 

Parting thoughts.

The shift from West Coast ports to East and Gulf Coast ports that started in 2021 has continued for the first nine months of 2022. For most of the first nine months of 2022, imports volumes operated in a range for the top ports. September, however, brought a large reduction in volume that affected mostly the top West Coast ports. 

Not surprisingly, top West Coast ports made the most progress in reducing wait times. East and Gulf ports have fared differently. Container import volumes have remained high versus previous years and, as a result, port delays have remained high. 

Not that importers and LSPs can “flip a switch” and quickly move some volume back to the West Coast, but the lingering labor situation could be holding back any desire to do it.

global trade import handling

What The First Half of 2022 Tells Us About Global Trade for the Future

So far, 2022 has shown that predicting global trade flows is harder than ever. Many of the predictions of the past year in terms of the economy and global trade have not transpired. Ports and related-inland logistics are still congested, and a number of factors continue to impact the reliability of global supply chains. High inflation and the Russian invasion threaten to depress the economy and ultimately global trade but have not yet made their impact fully felt. Here is a recap of key figures and events from the first half of 2022 that are contributing to a challenging second half of the year for global trade.

Volume. In early 2021, there were many predictions that global trade would slow after peak season and return to “normal” in 2022. Well, 2021 U.S. container import volume did not slow down and, in fact, was the biggest year ever—and then 2022 came along with volumes that have topped 2021 in every month so far (see Figure 1) despite calls for significant contraction and collapsing rates that didn’t materialize in the second quarter. Import volumes in the first half of 2022 are 4.9% higher than the same period in 2021. Pre-pandemic, the U.S. had a strained logistics infrastructure ,and the first half of 2022 shows 28.3% greater volumes than in 2019. Clearly, the significant increases in container import volumes have
continued to overwhelm the ports and related inland infrastructure. As long as U.S. monthly imports remain above 2.4 million containers, global supply chains will continue to experience congestion and
delays.

Figure 1: First Half Year U. S. Container Import Volumes

Source: Descartes Datamyne

With the delays the large West Coast ports were experiencing in 2021, importers began to shift some of the volume to East and Gulf Coast ports. In the first half of 2022, there was progress in reducing port delay times, especially for the West Coast Ports; however, with increased container volumes, East and Gulf Coast ports are not experiencing as much decrease in wait times (see Figure 2). In addition, the number of ships waiting at sea has dramatically increased again. According to MarineTraffic, in June 2022, the number of ships waiting to enter all U.S. ports combined increased by 36% to 125, with more than 64% of them sitting off East and Gulf Coast ports.

Figure 2: Port Wait Times 1H 2022

Source: Descartes Datamyne

Despite the highly publicized COVID-related lockdowns in China and in particular Shanghai, goods continued to flow from the country to the U.S. (see Figure 3). January 2022 was the peak of container volume imports at 991,373 TEUs while April 2022 was lower by only 7.7% when the lockdowns were in full effect. Expectations of a big surge of containers from China once the country fully emerged from lockdowns hasn’t happened so far and may be mitigated by the redirection of containers to open Chinese ports during the lockdowns.

Figure 3: 1H 2022 U.S. Imports from China

Economy. Consumer demand and a strong economy, the prime drivers of increased container imports, remained high in the first half of 2022. Consumer demand defied numerous predictions of a slowing economy or even recession. Unemployment for the last four months of the first half of 2022 was a steady 3.6%, which is 0.1% away from an all-time, non-war year low according to the U.S. Bureau of Labor Statistics (BLS). In addition, consumer spending on durable goods also remained high over the first half of the year. Growing inflation throughout the first half of 2022 (up 9.1% since June 2021) and a rising U.S. dollar compared to foreign currencies were potential economic dampening factors in the first half of 2022 that could come into play during the second half.

A substantial contributor to high inflation was energy/fuel costs, which were trending higher at the beginning of 2022 and then accelerated with the Russian invasion of the Ukraine in late February. The conflict-related sanctions, even if there is cessation of hostilities, are likely to remain in place and keep energy/fuel costs high for the future. One note, with exceptions for Ukraine and Russian exports, the Russian invasion has not significantly impacted global trade flow into the U.S.

Labor. Competition from all facets of the economy and continued high consumer demand for goods has made hiring logistics workers a challenge in the first half of 2022. It’s not that there hasn’t been a concerted effort as, per the BLS, the number of employed warehouse and driver workers has risen by 759,000 since the start of the pandemic. Instead, the sheer increase in contain import volume of 28.3% for the same period has outstripped the industry’s ability to keep up with the demand for more workers.

Labor unrest in the U.S. and abroad increases the potential risk for disrupted supply chains in the second half of 2022. The highly watched International Longshore and Warehouse Union (ILWU) contract negotiations that were anticipated to be addressed before the current contract expired on July 1 did not happen. Negotiations continue and there have not been any slowdowns or stoppages related to them.

However, another labor issue is compounding disruptions in California. Drayage owner-operators are protesting the refusal of the U.S. Supreme Court to hear the case challenging California law AB5, which would make them employees of carriers contracting the moves. The result has been a dray driver work stoppage at the Port of Oakland where ILWU workers refused to cross the picket line—the combination essentially shutting down the Port of Oakland. Internationally, work stoppages at major German ports due to ongoing contract negotiations threatens U.S imports from one of the top global exporters.

Pandemic. The rapidly mutating coronavirus continues to disrupt global supply chains. The most obvious example is the lockdowns in China; however, variants have rolled through other countries, like Vietnam where it significantly impacted the flow of goods out of that country. What have we learned about the coronavirus in 2022? It is mutating faster than our vaccines can control it, some regionally produced vaccines are not as effective as the North American and European versions, and country policies concerning the coronavirus are as much a consideration as the virus itself.

The first half of 2022 was as much about what didn’t happen in global trade and why it is hard to predict  if there will be less congestion and disruption for the rest of the year. The U.S. economy and container imports didn’t slow down. As a result, U.S. ports and related logistics infrastructure struggled to keep pace with the volume of imports despite some of the volume shifting from the West to East Coast ports.

The ILWU contract didn’t get settled and the coronavirus didn’t fade away. The potential for labor disputes and continued waves of COVID to negatively impact the flow of goods into the U.S. in the
second half of 2022 remains large. Until we see measurable changes in consumer demand and related container import volumes, and a reduction in some of the other disruptive factors, global supply chain and logistics professionals should treat the second half of 2022 with as much care and skepticism as the first half.