New Articles

Container Market Sentiment Signals Rebound: A ‘Shipper’s Market’ this Peak Season

intermodal cargo shipping container import logistics chain port containers

Container Market Sentiment Signals Rebound: A ‘Shipper’s Market’ this Peak Season

Container xChange, an online container logistics platform, published its August Container Market Forecaster today. Despite the ongoing market fluctuations, the Container Price Sentiment Index (xCPSI) has exhibited resilience and witnessed growth in July as compared to the month of June. The forecaster also noted that container prices have been relatively stable over the past 30 days (July) as compared to the previous 90 days (May-July).

container
Container Price Sentiment Index (xCPSI) by Container xChange


container
xCPSI survey for July 2023

The Container Price Sentiment Index (xCPSI) conducts market surveys concurrently and distils industry experts’ collective insights about container price trends into a quantitative measure, providing insight into near-future expectations for the container market dynamics. In July, 2,570 supply chain professionals participated in the survey. 

While the opinion is varied, still most respondents (42%) foresee an increase in container prices in the near-term which is indicative of potential market improvement, 28% foresee a further decline in container prices, suggesting a certain degree of pessimism in market conditions. 30% of those surveyed maintained that prices would remain unchanged. 

This growth in sentiment underscores the industry’s anticipation of an imminent turnaround, contributing a sense of positivity to the landscape.

Container Industry Stabilizing Amidst Market Fluctuations

Average container prices have been relatively stable in the last 30 days as compared to the price volatility over the past 90 days (30 days – July, 90 days – May-July). 

Analyzing a 30-day price delta comparison across key regions, the market has witnessed average price fluctuations ranging from -4% to +5.20% in the month of July 2023. However, the container prices have experienced a visible dip over a 90-day period, with Southeast Asia reporting a substantial -15.73% decline from May to July 2023. 

Despite this sustained dip, the sentiment index has stayed strong, even growing in July. The alignment of sentiment and pricing trends suggests an industry outlook that foresees a turning point, shifting away from skepticism towards a shared anticipation of market recovery despite ongoing price adjustments. 

container
Region-wise Container price volatility, Source: xChange Insights

Asian ports have been witnessing steady changes in average container prices for 40 HC cargo-worthy containers. For shippers, engaging in container trading or leasing within Southeast Asia at present, compared to three months prior or even just one month ago, presents a viable business prospect.

These average prices for 20 ft cargo worthy containers (region-wise) as of 9th August 2023 is illustrated in the graph below. 

Region-wise average prices for 20 ft cargo worthy containers

Carrier Capacity Management Spur Intra-Asia Trade Surge

According to Fitch Ratings, in the second quarter of 2023, China witnessed a 6% year on year increase in total container throughput, a significant improvement compared to 3% growth in first quarter of 2023. This expansion was primarily propelled by intensification of trade under the Regional Comprehensive Economic Partnership (RCEP), introduction of new foreign trade routes at the Dalian port, and upward trajectory of trade with nations participating in the Belt and Road Initiative.

A surge in demand for containers on Intra Asia trade lanes was observed on the platform, for example, the China to India stretch was popular in the month of July on Container xChange. 

Here are the top five stretches for both the 40 HC and 20 DC containers Ex China on xChange Insights as on 10th August 2023 – 

40 ft HC 20 ft DC
China to India China to United States
China to Russian Federation China to India
China to China China to Russian Federation
China to United Arab Emirates China to Canada
China to Belarus China to United Arab Emirates

Leasing charges for 40 ft HC containers on stretches Ex-China are amongst the top 10 stretches on xChange Insights indicating a bounce back from low leasing pick up charges over the last months.

Leasing charges for 40 HC containers on prominent trade stretches

Indications from Drewry point towards Asia’s entry into a peak season, resulting in a notable 42% surge in the Shanghai-Los Angeles spot rate over a four-week period concluding on August 3rd. Simultaneously, the Drewry Shanghai-Rotterdam index also saw a 20% upswing within the same duration.

Due to increased trade between India and the wider Asian region, ocean carriers are adding more capacity on the Intra-Asia trade route. This is also propelled by the sourcing diversification strategy in South Asia, particularly in countries like Vietnam and India. The aim is to increase shipment volumes and improve market presence. These changes in strategy allow these companies to optimise their operations and potentially strengthen their market position. This is important in a dynamic and competitive shipping industry.

United States: A potential Industry Rebound

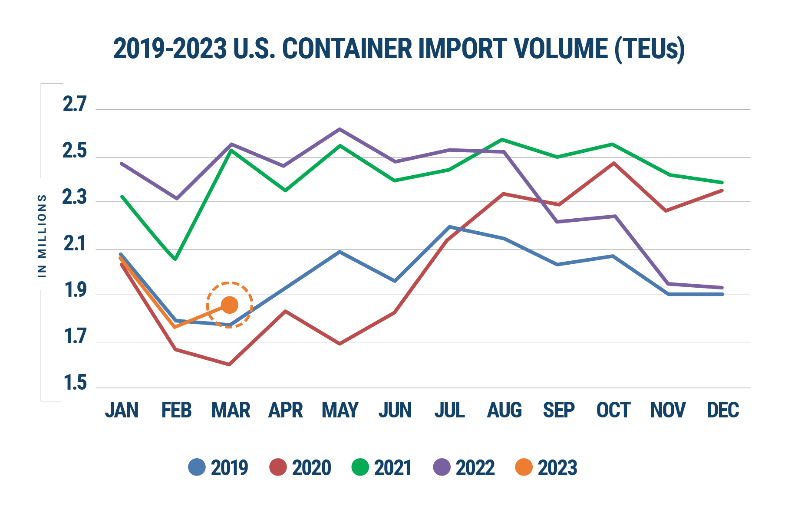
The Global Ports Tracker forecasts, provided by NRF (National Retail Federation), indicate that import cargo volumes are poised to reach their peak in August 2023. This surge aligns with retailers’ preparations for the winter holiday season stocking. 

Real GDP increased at an annual rate of 2.4% for the April-through-June period, after rising 2% in the first quarter this year, surpassing expectations and delaying concerns of a recession. 

The S&P Global Flash US Manufacturing PMI posted 49.0 in July, up from 46.3 in June indicates market improvement. A decrease of 0.5% in wholesale inventories also indicates that the inventories are becoming leaner in the US. 

“As economists shift from predicting recession to a ‘soft landing’, the industry holds its momentum. While some experts remain cautious, the foundation of a resilient economy, sustained consumer activity, and strategic federal investments improves the outlook of the upcoming holiday season.” shared Christian Roeloffs, cofounder and CEO, Container xChange

“It’s a shipper’s market this peak season as rates stabilize at below pre-COVID levels and capacity is abundant. Prices are low and this offers a great opportunity for exporters this peak season.” Roeloffs added. 

Eurozone Emerges from Technical Recession: A Turning Tide

In the second quarter of 2023, seasonally adjusted GDP increased by 0.3% in the euro area and was stable in the EU, compared with the previous quarter, according to a preliminary flash estimate published by Eurostat, the statistical office of the European Union. In the first quarter of 2023, GDP had remained stable in the euro area and had increased by 0.2% in the EU. Therefore, avoiding a technical recession in Eurozone. 

“Although we did avoid a technical recession in the Eurozone, retail trade is down by 0.3%, along with high inflation rate. These high prices will continue to exert pressure on operating costs for shipping companies. Carriers and freight forwarders should anticipate rising expenses related to provisioning ships and providing for crew members. Shippers might also experience increased costs for transporting goods, affecting overall supply chain costs.” Commented Roeloffs. 

“Short-term shipping demand may experience a boost, especially for routes connected to countries with stronger growth rates like Ireland and Spain. However, the potential for growth to be less robust than expected warrants cautious optimism. Prepare for potential shifts in shipping demand as companies explore more cost-efficient transport options during uncertain economic periods.” Added Roeloffs. 

The shipping industry’s course for the next few months is intricately woven with economic shifts, trade dynamics, and supply chain adaptations. As we approach the holiday season, the industry’s resilience and adaptability will be put to the test. 

intermodal cargo shipping container import logistics chain port containers

Recession in Germany to Cast Shadows on Europe’s Peak Season Imports

With Germany recording a recession this year, the demand for goods is expected to slow down in the coming peak season, contributing to a global trade slowdown. 

The further decline in consumer spending in the coming months will have a negative impact on peak season demand coming from Europe. 

“We anticipate that the recession now in Germany will reduce the economic activity resulting from dropping consumer demand for goods and services, which will in turn impact the peak season demand this year.” predicted Christian Roeloffs, cofounder and CEO, Container xChange, an online marketplace and operating infrastructure for container logistics. 

“Reduced consumer demand and economic activity in Europe can lead to decreased imports, affecting export-dependent economies. This can result in a slowdown in global trade and contribute to a broader economic downturn.” added Roeloffs. 

Amidst the current challenges posed by rising inflation and the subsequent increase in the cost of living, Europe and UK have witnessed labour strikes taking place this year across several European countries. Countries such as France, Portugal, Greece, Germany, and the Netherlands have experienced such strikes, causing disruptions at ports and significantly impacting the smooth flow of cargo movements.

“The consequences of these strikes have reverberated through the transportation and logistics sector, particularly at ports, which are vital hubs for global trade. Disruptions in cargo movements can lead to delays, increased costs, and logistical challenges for businesses relying on efficient supply chains. It further underscores the interconnectedness of various economic sectors and the importance of stable labor relations for sustained economic growth.” commented Roeloffs on the topic of industrial unrest in form of labour union strikes.

The demand has already dipped if we look at the port throughput in Hamburg, Rotterdam and Antwerp. 

All three ports announced declines in throughput over the three-month period (January – March 2023). The port of Rotterdam posted an 11.6 percent decline in container volume to 3.2 million TEU, a trend that started last year due to the elimination of volumes to and from Russia. Antwerp-Bruges handled 3.1 million TEU in the first quarter, a 5.7 percent drop that was led by a nearly two-thirds decline in Russia-related cargo.

Port of Rotterdam Reflects Declining Asian Imports (-14.2% in TEUs) amidst stock accumulation and inflation-driven demand drop

“As the recession takes hold, it is expected to have a significant impact on labour demands and inflation, exacerbating the already declining consumer demand. This, in turn, is likely to lead to negative retail inventory refilling throughout Europe. This will also have a negative impact on exports from Asia.” commented Roeloffs. 

Container Availability in Europe 

In the year 2021, ports in Europe witnessed a rise in values between week 9 to week 21 (March–May). Cyclic in nature, this was owing to a rise in the number of cargo-filled containers reaching these ports soon after the Chinese New Year until May end, as the retailers restocked heavily preparing for the peak season. This trend did not mirror in 2023. Clearly validating that the inventory replenishment was flat in these months in 2022 and in 2023. 

This could have a number of reasons. One, the invasion of Russia on Ukraine. The second, is the rising inflation and recession. And third, the resulting recessionary behaviours by the retailers and the consumers which leads to a slower trade, amongst many other effects. 

The CAx graphs below showcase the clear references from above. 

Hamburg CAx 20 ft DC 

Rotterdam CAx 20 ft DC 

Antwerp CAx 20 ft DC 

  • Container prices in Europe

We witness a general decline in the average container prices in Europe for 20 ft DC, while the prices for 40 ft HC have been relatively stable at the key ports. The trend is visible in the graphs below. 

Average container prices for 40 ft HC have not declined in May across key ports in Europe

container

Average container prices chart 40 ft High Cube_brand new  

Average container prices for 20 ft DC continue to decline in May across key ports in Europe

container

 Average container prices chart 20 ft DC cargo worthy

Ports in Europe 20 ft DC_ cargo worthy 40 ft HC_ Brand New
May ‘21 May ‘22 May ‘23 May ‘21 May ‘22 May ‘23
Rotterdam $1765 $1835 $902 $5794 $3736 $3353
Hamburg $2002 $2010 $1145 $5822 $3603 $3040
Antwerp $1890 $1876 $906 $5704 $3912 $2975

Year on Year comparison of average container prices in Europe

In 2023, the average container prices for 20ft and 40ft containers are down to almost half of what they were in 2021 when the demand for containers was at its peak. 

Annexure: 

*Container Availability index (CAx)

With CAx, you can check container availability in major ports worldwide. Learn where there is a shortage or oversupply of empty containers and leverage it for your trading and leasing business. 

Thanks to data on container and cargo movements, the CAx figures are forecasted for the next 4 weeks as well. 

A CAx value of 0.5 means that the same number of containers full of cargo leave and enter a port in the same week. CAx values above 0.5 mean that more containers with cargo enter and CAx values below 0.5 mean more containers with cargo leave a specific port. 

Low CAx values over a period of multiple weeks indicate a deficit of containers, and high values over a period of multiple weeks indicate a surplus of equipment at a specific port.


intermodal cargo shipping container import logistics chain port containers

U.S. Import Volume Growth: Is Global Supply Chain Performance Bouncing Back?

Amidst renewed whisperings of an impending recession in the second half of 2023 and the possibility of a debt default by the U.S. government that could trigger unemployment and surging interest rates, importers and logistics service providers (LSPs) are bracing for a potential hard landing. On balance, however, there are signs that a number of the challenges to global supply chain performance in 2023 are abating.

BIG GAINS IN IMPORT VOLUMES 

Partly driven by a spike in imports from China, U.S. container import volumes increased significantly in April 2023, rising 9% from March 2023 (Figure 1). Although container volume was down 17.8% from April 2022, imports were up 5.3% from pre-pandemic April 2019 and are continuing to track to 2019 levels—an encouraging trend.

Figure 1: U.S. Container Import Volume Year-over-Year Comparison

Source: Descartes Datamyne™

In a dramatic reversal of its downward trend, Chinese imports into the U.S. increased 26.7% in April 2023 compared to March volumes—representing 82% of the total volume increase from the top 10 countries importing into the U.S—although still down 26% from the August 2022 high. Compared to March 2023, April import volumes from Hong Kong (24.4%), Taiwan (19.3%), and Vietnam (13.8%) also increased significantly. In April 2023, China represented 36.8% of the total U.S. box imports, an increase of 5.2% from March, but still 4.7% below the high of 41.5% in February 2022. 

PORT PERFORMANCE IMPROVING 

In April 2023, U.S. container import volume at the top 10 ports increased 167,174 TEUs from March levels, with the Port of New York/New Jersey showing the greatest overall container volume increase (54,466 TEUs), followed by the Port of Savannah (24,923 TEUs). Given that the dramatic increase of Chinese imports in April should have favored West Coast ports, this growth pattern is somewhat counterintuitive. 

Notably, despite the increased activity, port delays declined significantly at all of the top ports (Figure 2). Signaling that global supply chain challenges are subsiding, port transit times were at their lowest level since 2021.

Figure 2: Monthly Average Transit Delays (in days) for the Top 10 Ports 

Source: Descartes Datamyne™

Note: Descartes’ definition of port transit delay is the difference as measured in days between the Estimated Arrival Date, which is initially declared on the bill of lading, and the date when Descartes receives the CBP-processed bill of lading.

CHALLENGES EASING

Importers and LSPs will be relieved that the two sides in the International Longshore and Warehouse Union (ILWU) and Pacific Maritime Association (PMA) negotiations are inching towards a new contract. Talks have been dragging on since May 2022 (the contract expired July 1, 2022) but PMA and the union have reached agreement on “certain key issues.” However, PMA commented that several important issues remain unresolved and work actions led by ILWU Local 13 at the Ports of Los Angeles and Long Beach continue to disrupt some operations at key marine terminals.

While some major shippers have been diverting cargo from the West Coast to ports on the East Coast and Gulf of Mexico to avoid potential work stoppages, there has been no serious impact on container processing, as has occurred in the past. The final resolution of the contract could bring some Asia-originating containers that had shifted to rival ports back to major California ports to take advantage of the shorter transit times.

While energy prices are generally moving in the right direction, fuel costs remain elevated, exerting continued pressure on the transportation budgets of importers and LSPs. The price of gasoline—a significant contributor to high inflation rates—increased slightly to $3.60/gallon but was down $0.58/gallon from the same time in 2022, according to the U.S. Energy Information Administration. 

Diesel costs also fell slightly to $4.02/gallon, a $1.49/gallon drop from April 2022. While declining fuel costs is always good news for logistics and supply chain companies, gasoline and diesel prices are likely to remain elevated for the foreseeable due to the disruption of global energy markets caused by the war in Ukraine and follow-on sanctions against Russia.

MANAGING SUPPLY CHAIN RISK

Although recent developments appear to indicate an easing of supply chain turbulence, importers and LSPs should keep an eye on several factors and ongoing issues that could cause further disruptions, tailoring their logistics and supply chain strategies accordingly to mitigate risk and promote financial stability.

1. Union issues and labor laws:

Logistics companies should closely monitor the progress of the IWLU-PMA contract negotiations. Progress is tediously slow but movement in either direction will impact port performance and the ability of importers to efficiently move their goods where they need to go. In addition, California’s AB5 legislation has the potential to cause more disruption at California’s port operations.

2. Port activity:

Importers and LSPs need to keep a close eye on import volumes and port transit times. Recent U.S. container imports are continuing to align with 2019 volumes but, if monthly TEU volumes surge to between 2.4M and 2.6M, as witnessed during the pandemic, ports and inland logistics would be under significant strain. 

Logistics companies should continue to seek out less congested transportation lanes, including smaller ports, to improve supply chain velocity and reliability. Evaluating alternative transportation lanes into the U.S., including entry through northern and southern borders and inland ports, is also a smart strategy to allay risk.

If port transit times decrease, as they did in April, it’s an indication that the efficiency of global supply chain capabilities has improved or, alternatively, that the demand for goods and logistics services is declining. Either way, pressure on the ports is relieved—good news for logistics-oriented companies.

3. Russia/Ukraine war and inflation

Importers and LSPs should monitor the ongoing impact of the Russia/Ukraine conflict on their logistics costs and capacity constraints, while ensuring that their key trading partners are not on sanctions lists. 

On the economic front, the latest Consumer Price Index report available (March 2023) showed a continuing decline in inflation, but the inflation rate remains elevated. Fuel prices—inextricably linked to inflation and a major component of logistics companies’ operational costs—should be monitored closely. Given that fuel prices will remain elevated indefinitely due to the war, logistics companies should evaluate ways to increase the fuel efficiency of their fleets, such as route optimization software or alternative-fuel vehicles. 

4. Ongoing pandemic impacts

While WHO recently declared that Covid-19 no longer represents a global health emergency—and the U.S. followed suit, terminating its federal COVID-19 Public Health Emergency act—the pandemic continues to impact global supply chain performance, especially in China. In fact, a 2023 analyst report declared that sourcing from Chinese manufacturers is tied to the largest supply chain risks; the possibility of delays and cancellations from Chinese suppliers is high due to the likelihood of COVID-19 localized disruptions in the country. 

FINAL THOUGHTS

The good news is that the pressure on supply chains and logistics operations is continuing to ease. However, we’re not in the clear just yet. Several challenges—from labor issues, elevated fuel prices, and economic uncertainty to the impact of the war in Ukraine and the lingering pandemic-related disruptions—continue to stress logistics operations. But by proactively monitoring key supply chain performance and economic indicators, importers and LSPs can address any capacity constraints or supply chain disruptions that may arise in the short term, while building long-term supply chain resilience to mitigate risk in the latter half of 2023 and beyond.


baltimore import mach electronic shipping route import 7LFreight Expands Instant Cargo Pricing and Booking for North American Forwarders Across Both Air and Trucking  import container descartes automation baltimore bridge container freight global trade

Descartes Releases April Global Shipping Report: March Volumes at Top West Coast Ports Increase Significantly

Descartes Systems Group, the global leader in uniting logistics-intensive businesses in commerce, released its April Global Shipping Report for logistics and supply chain professionals. U.S. container import volumes in March 2023 increased significantly from February 2023, largely driven by the Ports of Los Angeles and Long Beach, which was very counter intuitive, but kept the monthly trendline aligned with pre-pandemic 2019 volumes. Despite overall increases, port transit delays stabilized for all ports. Imports from China continued their downward trend and are almost 10% lower than their high in February 2022. The West Coast labor situation has still not been sorted out. The March update of the logistics metrics Descartes is tracking shows some consistency with pre-pandemic import volume seasonality but continues to point to challenging global supply chain performance in 2023.

March 2023 U.S. container import volumes increased 6.9% from February 2023 to 1,853,705 TEUs (see Figure 1). TEU volume was down 27.5% from March 2022, but up 4.2% from pre-pandemic March 2019. Two points to consider with the March numbers: 1) March has 31 days versus 28 for February and 2) With the Chinese Lunar New Year holiday occurring in January 2023, there still could be some impact on container import volumes in early March 2023.

Figure 1. U.S. Container Import Volume Year-over-Year Comparison

Chart, line chart Description automatically generated

Source: Descartes Datamyne™

“Container import volumes at the Ports of Los Angeles and Long Beach have been in decline, but in March they experienced significant increases (see Figure 2). 2023 continues to track 2019 volumes,” said Chris Jones, EVP Industry and Services at Descartes. “There was also good news in that the port transit delay times remained constant despite the significant volume increases.”

Figure 2: February to March Comparison of Import Volumes at Top 10 U.S. Ports

Source: Descartes Datamyne™

The March report is Descartes’ twenty-first installment since beginning its analysis in August 2021. To read past reports, learn more about the key economic and logistics factors driving the global shipping crisis, and review strategies to help address it in the near-, short- and long-term, visit Descartes’ Global Shipping Resource Center.

About Descartes

Descartes is the global leader in providing on-demand, software-as-a-service solutions focused on improving the productivity, performance and security of logistics-intensive businesses. Customers use our modular, software-as-a-service solutions to route, schedule, track and measure delivery resources; plan, allocate and execute shipments; rate, audit and pay transportation invoices; access global trade data; file customs and security documents for imports and exports; and complete numerous other logistics processes by participating in the world’s largest, collaborative multimodal logistics community. Our headquarters are in Waterloo, Ontario, Canada and we have offices and partners around the world.

vessel accident february

February Decrease Keeps 2023 U.S. Container Imports on 2019 Path

Descartes Systems Group, the global leader in uniting logistics-intensive businesses in commerce, released its March Global Shipping Report for logistics and supply chain professionals. The report shows February 2023 U.S. container imports decreased significantly from January 2023 but remained aligned with pre-pandemic 2019 volumes. Despite the reduction, port transit delays increased for the top West, East and Gulf Coast ports. Chinese imports followed the downward trend along with the rest of the top countries of origin. COVID continues to be a factor from ports of origin and the West Coast labor situation has still not been sorted out. The February update of the logistics metrics Descartes is tracking shows some consistency with pre-pandemic import volume seasonality but continues to point to challenging global supply chain performance in 2023.

February 2023 U.S. container import volumes decreased 16.2% from January 2023 to 1,734,272 TEUs (see Figure 1). Versus February 2022, TEU volume was down 25.0%, but only 0.3% lower than pre-pandemic February 2019. Two points to consider with the February numbers: 1) February has 28 days versus 31 for January and 2) With the Chinese Lunar New Year holiday occurring in January 2023, its impact on container import volumes would be seen in late February and early March 2023.

Figure 1. U.S. Container Import Volume Year-over-Year Comparison

Source: Descartes Datamyne™

“Examining imports from January and February in the previous six years, February 2023 volumes would have been expected to be significantly lower than January 2023 (see Figure 2),” said Chris Jones, EVP Industry at Descartes. “Declining container import volumes but rising port transit times demonstrate that, while 2023 volumes resemble 2019, global supply chain performance could remain uneven in 2023.”

Figure 2: January to February U.S. Container Import Volume Comparison


Source: Descartes Datamyne™

The March report is Descartes’ twentieth installment since beginning its analysis in August 2021. To read past reports, learn more about the key economic and logistics factors driving the global shipping crisis, and review strategies to help address it in the near-, short- and long-term, visit Descartes’ Global Shipping Resource Center.

About Descartes

Descartes (Nasdaq:DSGX) (TSX:DSG) is the global leader in providing on-demand, software-as-a-service solutions focused on improving the productivity, performance and security of logistics-intensive businesses. Customers use our modular, software-as-a-service solutions to route, schedule, track and measure delivery resources; plan, allocate and execute shipments; rate, audit and pay transportation invoices; access global trade data; file customs and security documents for imports and exports; and complete numerous other logistics processes by participating in the world’s largest, collaborative multimodal logistics community. Our headquarters are in Waterloo, Ontario, Canada and we have offices and partners around the world. Learn more at www.descartes.com, and connect with us on LinkedIn and Twitter.

baltimore import mach electronic shipping route import 7LFreight Expands Instant Cargo Pricing and Booking for North American Forwarders Across Both Air and Trucking  import container descartes automation baltimore bridge container freight global trade

Increase in U.S. Container Import Volumes Makes 2023 Look More Like 2019

Descartes Systems Group, the global leader in uniting logistics-intensive businesses in commerce, released its February Global Shipping Report for logistics and supply chain professionals. The report shows that January U.S. container import volumes increased from December to more tightly align with January 2019 levels. Port delays continue to decrease for top East and Gulf Coast ports but not for top West Coast ports. Key indicators during this period point to stronger than anticipated economic activity. This could impact future container import volumes but, combined with COVID, the Russia/Ukraine conflict and the West Coast labor situation, continue to highlight potential disruptions that could make for challenging global supply chain performance in 2023.

January 2023 U.S. container import volumes increased 7.2% from December 2022 to 2,068,493 TEUs (see Figure 1). Versus January 2022, TEU volume was down 16.1%, but only 0.3% lower than pre-pandemic January 2019. While the Chinese Lunar New Year holiday occurred in January, its impact on container import volumes won’t be felt until late February and early March 2023.

Figure 1. U.S. Container Import Volume Year-over-Year Comparison

“Comparing January 2023 import volume to growth of the previous five years, the 7.2% increase can be considered significant (see Figure 2) and Chinese imports rebounded with even stronger growth,” said Chris Jones, EVP Industry & Services at Descartes. “The January U.S. container import data shows some stability, but a number of issues continue to point to challenging global supply chain performance in 2023.”

Figure 2: December to January U.S. Container Import Volume Comparison

Source: Descartes Datamyne™

The February report is Descartes’ nineteenth installment since beginning its analysis in August 2021. To read past reports, learn more about the key economic and logistics factors driving the global shipping crisis, and review strategies to help address it in the near-, short- and long-term, visit Descartes’ Global Shipping Resource Center.

About Descartes

Descartes is the global leader in providing on-demand, software-as-a-service solutions focused on improving the productivity, performance and security of logistics-intensive businesses. Customers use our modular, software-as-a-service solutions to route, schedule, track and measure delivery resources; plan, allocate and execute shipments; rate, audit and pay transportation invoices; access global trade data; file customs and security documents for imports and exports; and complete numerous other logistics processes by participating in the world’s largest, collaborative multimodal logistics community. Our headquarters are in Waterloo, Ontario, Canada and we have offices and partners around the world.

charleston

Port of Charleston Completes Record Volumes in April

Following the most successful all-time cargo record for March, South Carolina Ports Authority confirmed earlier this week the Port of Charleston broke the April record for cargo handled. More than 225,000 twenty-foot equivalent units (TEUs) were moved in April from Wando Welch Terminal, North Charleston Terminal and Hugh K. Leatherman Terminal, representing an upward growth trend of 27.8 percent in a year and 2.09 million TEUs in fiscal year 2021 so far.

“Companies needing to quickly import and export goods benefit from the available capacity at SC Ports,” SC Ports CEO Jim Newsome said. “We have invested significantly in our infrastructure, including enhancing Wando Welch Terminal and opening Leatherman Terminal, to ensure Charleston can handle the biggest ships and growing cargo volumes coming to the East Coast.”

Vehicles, containers, and inland ports were among segments of business growth in April. Loaded imports accounted for a 27 percent increase for the month along with a 30 percent surge in loaded exports. Manufacturing and automotive industries in the region were cited as main drivers behind the increase.

April also saw a 143.1 percent increase in vehicles. SCPA reported 21,966 vehicles rolled the docks at the Columbus Street Terminal, representing the 209,598 vehicles handled so far for the fiscal year (a 14.5 percent increase).

“Our entire maritime and motor carrier community kept freight moving during the past year. We owe them much gratitude for keeping our shelves stocked and businesses running during the pandemic,” Newsome said. “As the global supply chain continues to feel strained, it is evident that SC Ports invested in the right infrastructure at the right time. We have the capacity, big-ship capabilities and deep harbor today to handle cargo influxes.”