New Articles

Surge in U.S. Inbound Containers Signals Economic Growth in 2024

growth

Surge in U.S. Inbound Containers Signals Economic Growth in 2024

In the opening months of 2024, the United States has witnessed a significant surge in inbound container volumes, signaling robust economic activity. According to analysis by renowned analyst John McCown, imports at the nation’s top ten ports experienced a remarkable growth of nearly 20% year-on-year in March.

The dominance of these ports, which handle 86% of U.S. import traffic, underscores the resilience of the world’s largest economy. Despite a slight dip from February’s growth rate of 26.5%, March’s 19.2% increase in inbound containers reaffirms the ongoing strength of economic momentum.

McCown emphasized the sustained growth trajectory, pointing out that the trailing three-month figure shows a substantial 17.8% increase compared to the previous year. This growth, unaffected by the timing impact of events like the Chinese New Year, reflects underlying economic vitality, with comparisons now less influenced by pandemic-related disruptions.

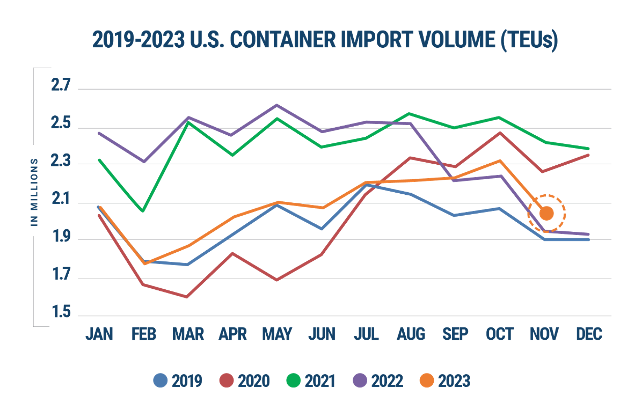
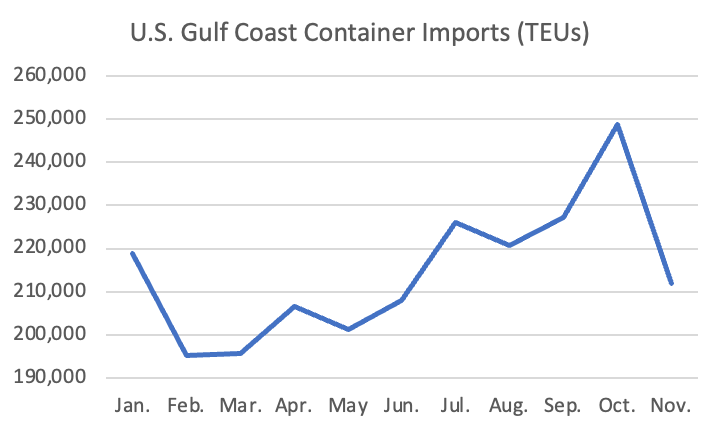
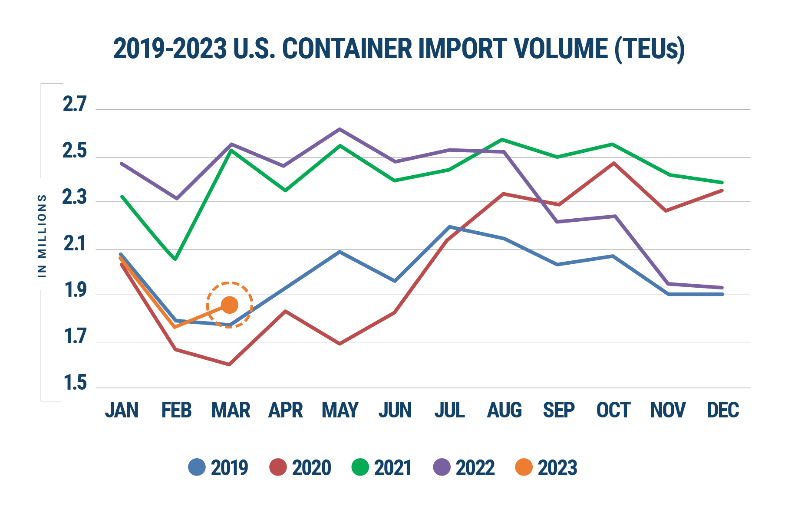
In March, total import volumes reached nearly 1.82 million TEU (twenty-foot equivalent units), marking the first turnaround in seven months for ports on the east and Gulf coasts. These ports outpaced their Pacific coast counterparts, growing at a rate of 21.9% compared to 16.2% growth on the west coast.

Leading the pack, Los Angeles retained its position as the country’s primary import gateway, handling just under 380,000 TEU with growth slightly below the market average at 18.6%. New York & New Jersey followed closely, experiencing a growth of 19.6%, while Long Beach, although third in volume, exhibited the slowest growth among the top ten ports at 8.4%. Notably, Oakland emerged as the fastest-growing port, with volumes soaring by 38.4% year-on-year.

In addition to the surge in imports, U.S. exports continued their upward trajectory, growing by 7.6% year-on-year to reach 930,500 TEU. Los Angeles surpassed Houston as the leading export port, with a substantial 47.3% year-on-year increase.

However, the performance across ports varied, with some witnessing declines or stagnation in export volumes. Despite Houston’s strong growth, Long Beach experienced a significant decline of 21.3% compared to March 2023, while Norfolk and Charleston remained relatively flat.

Analyzing the data over a five-year period, McCown highlighted the disparity among ports, with Houston exhibiting the strongest growth since pre-pandemic levels in March 2019, while Seattle/Tacoma lagged behind with negative growth rates.

The surge in inbound containers and the upward trajectory of exports underscore the resilience and vitality of the U.S. economy in 2024, reflecting positive trends in global trade and commerce.

baltimore import mach electronic shipping route import 7LFreight Expands Instant Cargo Pricing and Booking for North American Forwarders Across Both Air and Trucking  import container descartes automation baltimore bridge container freight global trade

November Sees 9% Drop in US Container Imports; Panama Drought Affects East and Gulf Coast Ports

Descartes Systems Group (Nasdaq: DSGX) (TSX:DSG), the global leader in uniting logistics-intensive businesses in commerce, released its December Global Shipping Report for logistics and supply chain professionals. In November 2023, U.S. container import volume decreased 9% from October 2023, with East and Gulf Coast ports experiencing the greatest declines. While the decrease is large, it’s consistent with monthly reductions at the end of prior years. Imports from China also continued to decline, but at a slightly faster pace than the overall numbers. The Panama drought finally appears to be negatively impacting U.S. container import volume at East and Gulf Coast ports, which could worsen with the Panama Canal Authority’s plans to further reduce the number of daily transit slots in coming months. The December update of the logistics metrics Descartes is tracking shows a decline consistent with seasonal import patterns and signs that global supply chain performance improvements have stalled.

November 2023 U.S. container import volumes decreased 9.0% from October 2023 to 2,099,408 twenty-foot equivalent units (TEUs) (see Figure 1). Versus November 2022, TEU volume was higher by 7.4%, and up 10.4% from pre-pandemic November 2019. The growth in import volume over the first eleven months of 2023 is within 4.0% of the same period in 2019.

Figure 1. U.S. Container Import Volume Year-over-Year Comparison

Source: Descartes Datamyne™

“November has traditionally been a weaker month than October and while the decline is steep, it is consistent with other years’ performance,” said Chris Jones, EVP Industry at Descartes. “The impact of the drought in Panama is finally hitting as volumes at the Gulf Coast ports (see Figure 2) and, in particular, the port of Houston(-26.7%) are considerably lower than the overall decline. East Coast ports experienced a significant decrease as well.”

Figure 2: U.S. Gulf Coast Container Imports for 2023

Source: Descartes Datamyne™

The November report is Descartes’ twenty-eighth installment since beginning its analysis in August 2021. To read past reports, learn more about the key economic and logistics factors driving the global shipping crisis, and review strategies to help address it in the near-, short- and long-term, visit Descartes’ Global Shipping Resource Center.

international

US Airport Rankings – The Best and the Worst for 2023

A poor air travel experience can derail any trip. Whether it’s business or pleasure, getting through the airport and on to your destination, with some nice perks in between, is a shared objective. US travel can be hectic but some airports do it better than others. 

The Wall Street Journal held its annual “US Airport Rankings” and the 2023 edition has arrived. The Journal examines the nation’s 50 busiest airports using metrics such as value, convenience, and reliability among others. In total, roughly 30 factors are evaluated per airport and then complemented with traveler survey input. Once the numbers are tabulated the airports are then divided into large and midsize categories. 

Phoenix (PHX)

This year’s number one large airport is Phoenix Sky Harbor International Airport. Flight delays are few, the weather is nearly always great, and perhaps best of all, Sky Harbor is easy to get to. But in addition to favorable weather and first-class infrastructure, it also helps that Sky Harbor is home to American and Southwest Airlines which carry up to 75% of the airport’s passengers. These two airlines score well in reliability and the average taxi-out time (from when a plane leaves the gate to takeoff) is under 15 minutes. Some of the Journal’s worst-rated airports featured taxi-out times north of 26 minutes. 

Sky Harbor’s overall score was 63.4 and Minneapolis-St. Paul International Airport came in a close second at 63.2. There was no airport on the list that scored a perfect 100. The fact that 63.4 was the top score in the large airport category shows how entangled and complicated it can be running a 24-hour business where users seek ease of use, reliability, and great customer service. 

San Jose (SJC)

San Jose Mineta International Airport took home the crown in the midsize category. The Northern California airport scored 71.2 and lived up to its tagline – Fly Simple. SJC boasts best-in-industry on-time performance, expedited security lines, as well as short walks to nearly everything a traveler could ask for within the airport.   

Last year’s midsize winner, Sacramento (SMF), finished a close third with 70.0 points while San Antonio surprised the group finishing second with a score of 70.4. 

Northeast Woes

The two worst-performing large airports were Newark Liberty International Airport (EWR) and John F. Kennedy International Airport (JFK) out of New York. Departure delays and weak infrastructure unable to handle heavy arrivals dragged the two to dismal rankings – 43.6 for JFK and 37.6 for EWR. JFK is in the midst of significant upgrades while Newark is hoping its newly redesigned Terminal A will help to ameliorate some of the more persistent issues. The greater New York/New Jersey area certainly deserves better.   

food bank

SC Ports Boosts Holiday Giving with $25,000 Contribution to Lowcountry Food Bank

In the spirit of holiday generosity, SC Ports is making a meaningful impact by donating $25,000 to the Lowcountry Food Bank. The charitable organization, catering to over 200,000 individuals annually, can provide up to five meals per dollar donated.

SC Ports President and CEO Barbara Melvin emphasized the importance of extending economic benefits beyond daily operations and directly into the community. This substantial donation aims to support the Lowcountry Food Bank’s mission in combating hunger and making a direct, positive impact on thousands of people in need.

The Lowcountry Food Bank, which distributed 33 million meals to over 200,000 residents in the previous year, plays a vital role in ensuring equitable access to healthy food for the community. SC Ports’ ongoing support aligns with the organization’s commitment to providing relief to the most vulnerable residents facing economic hardships.

This marks the fourth consecutive year that SC Ports has contributed to the Lowcountry Food Bank, showcasing the company’s dedication to fostering community well-being during the holiday season and beyond.

intermodal cargo shipping container import logistics chain port containers

The Intermodal Association of North America and the Bureau International des Containers Expand Collaboration to North America Geofencing

The Intermodal Association of North America (IANA) and the Bureau International des Containers (BIC) are extending their collaboration on container facility identification, which began in 2021, to include geofencing. IANA will take the leadership role in collecting and reviewing geofence coordinates for North American intermodal facilities for inclusion in the global BIC Facility Code database and in the IANA Intermodal Facilities Directory.

The BIC Facility Code database is a global database of over 17,000 container facilities and provides a facility name and address, latitude/longitude point and harmonized facility code. As part of the 2021 harmonization exercise, the locations in IANA’s North American Intermodal Facility database were assigned a global BIC Facility Code, and an API synchronization was put in place.

The database is being expanded to include geofences coordinates to help support the industry’s adoption of smart containers. The methodology and recommendations for the project were developed by a global working group assembled by the United Nations Center for Trade Facilitation and Electronic Business (UN/CEFACT) and includes ocean carriers, IoT providers, and software platforms.

The objective is to provide a neutral open library of geofences linked to container handling facilities to ensure that all parties in the supply chain can reference the same geofence for a facility regardless of the provider or platform they may be using, thus improving reliability, interoperability as well as safety and security.

BIC staff will attend IANA’s Intermodal EXPO in Long Beach, September 11-13 to explain the new platform and to assist depot and terminal operators/owners in setting up geofences for their facilities.

baltimore import mach electronic shipping route import 7LFreight Expands Instant Cargo Pricing and Booking for North American Forwarders Across Both Air and Trucking  import container descartes automation baltimore bridge container freight global trade

Descartes Releases April Global Shipping Report: March Volumes at Top West Coast Ports Increase Significantly

Descartes Systems Group, the global leader in uniting logistics-intensive businesses in commerce, released its April Global Shipping Report for logistics and supply chain professionals. U.S. container import volumes in March 2023 increased significantly from February 2023, largely driven by the Ports of Los Angeles and Long Beach, which was very counter intuitive, but kept the monthly trendline aligned with pre-pandemic 2019 volumes. Despite overall increases, port transit delays stabilized for all ports. Imports from China continued their downward trend and are almost 10% lower than their high in February 2022. The West Coast labor situation has still not been sorted out. The March update of the logistics metrics Descartes is tracking shows some consistency with pre-pandemic import volume seasonality but continues to point to challenging global supply chain performance in 2023.

March 2023 U.S. container import volumes increased 6.9% from February 2023 to 1,853,705 TEUs (see Figure 1). TEU volume was down 27.5% from March 2022, but up 4.2% from pre-pandemic March 2019. Two points to consider with the March numbers: 1) March has 31 days versus 28 for February and 2) With the Chinese Lunar New Year holiday occurring in January 2023, there still could be some impact on container import volumes in early March 2023.

Figure 1. U.S. Container Import Volume Year-over-Year Comparison

Chart, line chart Description automatically generated

Source: Descartes Datamyne™

“Container import volumes at the Ports of Los Angeles and Long Beach have been in decline, but in March they experienced significant increases (see Figure 2). 2023 continues to track 2019 volumes,” said Chris Jones, EVP Industry and Services at Descartes. “There was also good news in that the port transit delay times remained constant despite the significant volume increases.”

Figure 2: February to March Comparison of Import Volumes at Top 10 U.S. Ports

Source: Descartes Datamyne™

The March report is Descartes’ twenty-first installment since beginning its analysis in August 2021. To read past reports, learn more about the key economic and logistics factors driving the global shipping crisis, and review strategies to help address it in the near-, short- and long-term, visit Descartes’ Global Shipping Resource Center.

About Descartes

Descartes is the global leader in providing on-demand, software-as-a-service solutions focused on improving the productivity, performance and security of logistics-intensive businesses. Customers use our modular, software-as-a-service solutions to route, schedule, track and measure delivery resources; plan, allocate and execute shipments; rate, audit and pay transportation invoices; access global trade data; file customs and security documents for imports and exports; and complete numerous other logistics processes by participating in the world’s largest, collaborative multimodal logistics community. Our headquarters are in Waterloo, Ontario, Canada and we have offices and partners around the world.

picture of a ship at a port

More Funding now Flowing to U.S. Ports for Modernization Projects

American ports, even those that are among the busiest in the world, have faced near-crippling levels of congestion since the outbreak of COVID. Supply chain back-ups have also had a negative impact. The smaller ports especially have scrambled to meet demand, but it is obvious that operational inadequacies at all U.S. ports must be addressed. Now, significant public investment is opening up for port projects of all types.

With funding support from the federal government, port authorities in each coastal region are being upgraded, modernized and electrified. The goal is sustainability because America’s ports are huge contributors to the country’s GDP.

Most of the improvements will apply to deficiencies in cargo handling because container vessels idling outside of ports have consistently increased over the past three years. This issue must be addressed, and U.S. ports must improve their capabilities. Immediate needs and objectives include electrifying cargo handling equipment, upgrading shore power, enhancing electric grid infrastructure and exploring new port-side applications for hydrogen energy.

To assist with all this, the federal government is disbursing billions of dollars to ports through grant programs. The Inflation Reduction Act allocates $3 billion to fund acquisition and installation of zero-emission equipment at ports. Another $1 billion is available to help port authorities electrify their fleets of heavy-duty vehicles. Additionally, $662 million is available through the Department of Transportation’s Maritime Administration. Very soon, 50 funding grants to support projects that improve efficiency and reliability of port operations will be announced.

Examples of upcoming projects now being planned include the following.

The Port of Oakland in California is planning a $48.9 million project to modernize one of its terminals. The port, which is the ninth busiest in the U.S., will use the bulk of its funding for energy and infrastructure improvements. Components of the project will include improvements such as an off-dock container support facility with commercial truck access, perimeter fencing, upgraded storage facilities, refrigerated container storage, LED lighting, drainage enhancements, substation improvements, battery storage and the addition of charging stations. A significant number of the improvements will be scaled to bolster capacity, reliability and resilience of the port’s electrical grid.

Planning officials with the Port of Coos Bay in Oregon will launch a $1.8 billion project to deliver a new rail line, another navigation channel and a container terminal. A public-private partnership will steer the project through its planning phase. Once that is accomplished, construction will launch in 2024. The project will create infrastructure for 12 new trains between the port and nearby city of Eugene and mitigate supply chain congestion that continues to logjam operations.

Another large allocation of funding will be required for the launch of a port project in Anchorage, Ala. This initiative carries a cost projection of approximately $2.2 billion. Port officials and local leaders are working together to oversee the initiative. The updated concept involves construction of two identical terminals to support new cargo-handling cranes that will be roughly three times the size of the port’s current, outdated cranes. State officials have approved $200 million in capital funding and the port will leverage that for matching federal funds to cover the remaining project costs.

State lawmakers in Virginia recently amended the state’s newest budget to allow funding for a new inland port in the southwestern county of Washington. The $65 million project, which also received approval from Washington County officials, is currently in the preliminary planning stage. Features of the initiative will likely include a new rail connection for shipping goods to and from the Port of Virginia to the coastal city of Norfolk.

The Gulf Coast of Texas is planning numerous port-focused contracting opportunities focused on electrification, modernization, resilience and efficiency. Recently, officials representing the Port of Galveston announced plans to issue $100 million in bonds to support the delivery of critically needed improvements. Approval of the bond issue will launch work on projects that include a new cargo complex, upgrades to an existing cruise terminal, and construction of a new, fourth terminal at the port.

Also in Texas, the Port of Corpus Christi has plans for a $1 billion initiative that will include two projects. The first effort will focus on improving existing terminals and the other project will expand terminal storage. Both projects are outlined in the recently released Texas Port Mission Plan for 2024-2025. Additionally, the Port of Corpus Christi Authority is working with the U.S. Army Corps of Engineers on a $682 million ship channel project which will be in development during the same timeframe.

A new port rail connection in New Jersey will carry a large price tag – approximately $100 million. Officials at Port Elizabeth plan to address much-needed upgrades and enhancements. Soon, the port authority plans to allocate funding to improve port operations and finalize the planning of a new port rail connection which will be delivered through a public-private partnership. The new track will connect a regional rail station to the broader national rail network. Construction is slated to begin following selection of a preferred alternative design (tentatively expected in June 2023).

Officials at Southern Florida’s Port Miami, which ranks as the 10th busiest port in the U.S., will announce plans for a landmark capital spending plan. Over the next five years, the port will undergo a series of construction projects with a combined budget of $1.2 billion. The projects will expand cargo operations and position the port to capture a greater amount of the economic activity that is being routed away from congested ports. One objective will be to invest $55 million in new cargo-handling cranes that can operate on the port’s electrical grid. Once this initial work is completed, port officials will begin to work on another $1.6 billion in longer-term capital improvement initiatives.

Companies with offerings and services that can be provided to port authorities will find officials eager to discuss their upcoming initiatives. Federal funding as well as alternative funding will be available, and the only delay now is the wait for planning and design work to be completed.

coast

Top U.S. Port Analysis: A Tale of Two Coasts in 2022

The pandemic put global trade flows in play with significant changes in U.S. container import volumes, not only at the coast level, but at individual ports as well. Much has been made of the challenges that the top West Coast ports faced in 2021 and subsequent shifts in container volume from the West to East and Gulf Coast ports. September 2022’s significant overall decline in import volume of 12.4% versus August 2022 shows how other factors are unevenly impacting the coasts, such as an even larger decline in Chinese imports. The top East and Gulf Coast ports were much less affected by September’s volume decline (see Figure 1) but, unfortunately, they are still experiencing extended delays. 

Here’s how the top U.S. ports faired for the first nine months of 2022. 

Figure 1: TEU Volume at Top West versus East and Gulf Coast Ports

Source: Descartes Datamyne™

A closer look at fluctuating volumes.

Overall, in the first nine months of 2022, the top East and Gulf Coast ports benefited from the shift away from the top West Coast ports (see Figure 2). As of September 2022, the top East and Gulf Coast ports have 48.2% of the total container imports while the top West Coast ports’ share has dropped to 37% from a high of 47% in May of 2021.

Figure 2: Aggregate TEU Volume at Top West vs. East and Gulf Coast Ports

Source: Descartes Datamyne

On an individual basis, the ports of Houston, Charleston, and Long Beach had the greatest percentage growth in import container volume in 2022 (see Figure 3). The Port of Long Beach benefited from the growth and processed the greatest number of containers (3,874,481). While the Port of Los Angeles experienced a significant decline, it still processed the second highest number of containers (3,794,096), followed by the Ports of New York/New Jersey (3,394,935). Tacoma saw the greatest percentage decline followed by the Port of Los Angeles. In sheer numbers, the Port of Los Angeles saw the greatest decline in container volume (-512,401). 

Figure 3: Growth in TEU Volume at Top Ports: First 9 Months of 2022 vs. 2021

Source: Descartes Datamyne

The China factor.

Because it contributes a large percentage of U.S. imports, China has always been an important driver of overall container volume. However, while imports from China were marginally depressed during the spring lockdowns, other countries such as India and Germany helped to keep volumes high (see Figure 4). This can be seen particularly in September as U.S. import volumes from China were down 18.3% to 820,329 TEUs compared to August 2022, but overall U.S. import volume only declined 12.4%. As Chinese imports are heavily skewed to West Coast ports, they were the ones most impacted by the slowdown in China.  

Figure 4: Total U.S. and Chinese Import Volume (2022)

coast

Source: Descartes Datamyne™

Persistent port delays for the top East and Gulf Coast ports.

Throughout 2022, port delays have been fairly consistent with port volumes with one significant exception (see Figure 5). Most of the top West Coast ports saw their delays decline as their volumes declined. The top East and Gulf Coast ports had a relatively steady stream of imports and their wait times only declined slightly. The exception to all of this has been the Port of Long Beach which had a 10% increase in container volume, but also saw a 59% decrease in wait time. 

Figure 5: Monthly Average Delays (in days) at Top 10 Ports 

coast

Source: Descartes Datamyne™

Note: Descartes’ definition of port delay is the difference as measured in days between the Estimated Arrival Date, which is initially declared on the bill of lading, and the date when Descartes receives the CBP-processed bill of lading.

External factors impacting remainder of 2022. 

The continuing labor situation may be a factor that has been keeping most West Coast ports from recovering some of their volume in 2022. The International Longshore and Warehouse Union (ILWU) contract expired on July 1 and remains ongoing, though there has been no impact on container processing as has been the case in the past. California law AB5 also became a significant issue in 2022. Currently, no resolution is in sight and there is a risk that more AB5-related stoppages could occur at California ports in the future, causing greater disruption. 

Parting thoughts.

The shift from West Coast ports to East and Gulf Coast ports that started in 2021 has continued for the first nine months of 2022. For most of the first nine months of 2022, imports volumes operated in a range for the top ports. September, however, brought a large reduction in volume that affected mostly the top West Coast ports. 

Not surprisingly, top West Coast ports made the most progress in reducing wait times. East and Gulf ports have fared differently. Container import volumes have remained high versus previous years and, as a result, port delays have remained high. 

Not that importers and LSPs can “flip a switch” and quickly move some volume back to the West Coast, but the lingering labor situation could be holding back any desire to do it.

coast lineage

East Coast Congestion now Worse than West Coast

According to MarineTraffic, more ships are now waiting outside US East Coast ports than along the West Coast.

As of today (7 April) 15 containers vessels carrying a total of 95,000 TEU are at anchor, waiting to enter the Ports of Los Angeles and Long Beach.

At the same time, 18 ships are waiting off port limits to berth at the Port of Charleston, and 12 are outside the Port of Norfolk. These vessels are carrying a combined total of 209,000 TEU.

Shipping expert Lars Jensen previously noted that vessel queues outside Charleston were rising, as 31 vessels were waiting to berth at the port on 25 February.

“As can be seen on vessel finder there are also large queues of vessels outside the other major US East and Gulf Coast ports. It thus appears that part of the reason for the improvement in California is not that the supply chain problem is being resolved – the problem is merely being shifted elsewhere,” Jensen said in a social media post.

About Port Technology International

The maritime industry sits at the center of the global economy, and ports and terminals are vital to ensuring the safe passage of goods across the supply chain. Massive technological changes mean now is a great time to enter the industry, with the biggest ports, terminal operators, carriers and logistics firms investing heavily to connect cities, countries and regions through the power of trade.

Port Technology International has been the leading industry print Journal for 20 years. Published four times a year, the journal is the only technical preview and review of advanced technologies for ports, harbors and terminals world-wide. This is complimented by the world No 1 website for news, technical content and sourcing suppliers plus a portfolio of events bringing leading industry professionals together.

Each edition of the PTI Journal features over 30 technical papers written by leading industry professionals, which reflect emerging trends and technical advances that enhance efficiency and increase productivity in ports and terminals. The journal is divided into distinctive sections, reflecting every aspect of operation in the port or terminal.

The Port Technology website is the World’s Leading Technology website for Ports & Terminals. The entire industry is dependent on “Speed” which only comes from technology.

pennsylvania's jersey

Pennsylvania Governor Extends Cargo Growth Scheme for Another Year

Governor Tom Wolf has extended Pennsylvania’s Intermodal Cargo Growth Incentive Program (PICGIP) until July 2023.

The program was initially established in 2015 through the Pennsylvania Department of Transportation’s (PennDOT) Multimodal Fund and makes up to $1 million available annually to participating ocean carriers that move cargo through the state’s ports.

In turn, the scheme helps secure full time employment at the terminals and increase economic activity through indirect and induced jobs.

The PICGIP was previously expected to end in June 2021.

© Governor Tom Wolf

“Pennsylvania’s ports are more vital than ever and are continuing to increase the volume of essential goods and strengthen the supply chain,” said Wolf.

“Increasing shipping activity will help ensure that goods are delivered to stores in a timely manner.”

In order to be eligible, carriers that have not docked at the Port of Philadelphia (PhilaPort) in the past six months are required to fill out an application on the PennDOT website, whereas existing participants only need to complete a data verification form.

Jeff Theobald, CEO and Executive Director of PhilaPort, added: “The Intermodal Cargo Growth Incentive Program is essential for us to compete with other ports in attracting new ocean carriers and new trade lanes to Pennsylvania.

“This program supports the ocean carrier during the difficult initial phase of entering a port for the first time or starting a new service.

“This is a well-designed program, and PennDOT has done a great job assisting us with implementing it.”

New carriers that sign onto the program will receive $25 per new container unit loaded or discharged per vessels from a Pennsylvania Port. Existing participants qualify for the incentive payment by exceeding established benchmarks.

Since its inception, container lifts of participants have nearly doubled, demonstrating PICGIP’s use to the business growth of Pennsylvania ports.

In February this year, PhilaPort also received a $246 million state investment from the governor to continue its modernisation efforts.

The sum aimed to build upon his previous $300 million Capital Investment Program announced in 2016.