New Articles

Descartes Releases April Global Shipping Report: March U.S. Import Container Volume Continues Strong Trajectory

global trade unctad baltimore bridge supply chain import

Descartes Releases April Global Shipping Report: March U.S. Import Container Volume Continues Strong Trajectory

Descartes Systems Group, the global leader in uniting logistics-intensive businesses in commerce, released its April Global Shipping Report for logistics and supply chain professionals. In March 2024, U.S. container import volumes increased 0.4% from February, but jumped 15.7% when compared to the same month last year, indicating exceptional growth when considering the impact of the Chinese Lunar New Year on the second half of March.

Compared to February 2024, imports from China continued to decline because of the Chinese Lunar New Year, reflected by a significant volume loss at the Port of Los Angeles for the second consecutive month. Port transit delays continue to improve as the drought in Panama and Middle East conflict have yet to impact East and Gulf Coast ports. April’s update of logistics metrics monitored by Descartes show that the first quarter of 2024 has been a strong start for U.S. container imports; however, concerns around global supply chain performance are still expected throughout the year because of ongoing conditions at the Panama and Suez Canals, upcoming labor negotiations at U.S. South Atlantic and Gulf Coast ports, Middle East conflict, and the impact of the Baltimore Bridge collapse which remains to be fully reflected in U.S. container import volume data.

U.S. container imports maintain year-over-year strength.

March 2024 U.S. container import volumes remained mostly flat from February 2024, increasing only 0.4% to 2,145,341 twenty-foot equivalent units (TEUs) (see Figure 1). Versus March 2023, however, TEU volume was higher by 15.7%, and up 20.6% from pre-pandemic March 2019, demonstrating that year-over-year performance remains strong. The Chinese Lunar New Year may have masked even stronger growth as it occurred on February 11 and the holiday extended the entire week, which means its impact on U.S. imports did not occur until the second half of March 2024. For a more representative view, Descartes compared the first 15 days of March 2024 to the same time period in 2023 as these time periods were less likely to be impacted by the Chinese Lunar New Year. In this timeframe, U.S. container import growth was 22.7%.

Figure 1. U.S. Container Import Volume Year-over-Year Comparison

A graph of different colored linesDescription automatically generated
Source: Descartes Datamyne™

 “Considering declining import volumes from China, March 2024 was a strong month and continues the robust performance that began in January 2024,” said Chris Jones, EVP Industry, Descartes. “Despite the combined effect of the Panama drought and the conflict in the Middle East, port transit delays showed continued improvement across nearly all the top ports, as March volumes at East and Gulf Coast ports remained stable.”

The April report is Descartes’ thirty-second installment since beginning its analysis in August 2021. To read past reports, learn more about the key economic and logistics factors driving the global shipping crisis, and review strategies to help address it in the near-, short- and long-term, visit Descartes’ Global Shipping Resource Center.

baltimore import mach electronic shipping route import 7LFreight Expands Instant Cargo Pricing and Booking for North American Forwarders Across Both Air and Trucking  import container descartes automation baltimore bridge container freight global trade

February U.S. Import Container Volume Continues Strong Performance: Descartes

Descartes Systems Group, the global leader in uniting logistics-intensive businesses in commerce, released its March Global Shipping Report for logistics and supply chain professionals. In February 2024, U.S. container import volumes declined 6% from January, but jumped 23.3% when compared to the same month last year. We would expect the month-over-month results to be smaller as February is a shorter month. The year-over-year results would indicate exceptional growth; however, they do not take into account the impact of the Chinese Lunar New Year on the February 2023 results. The growth is still strong but, based upon Descartes’ analysis, it is more likely to be ~13%, which is further explained below.

Compared to January 2024, imports from China reversed their robust growth in February, which impacted West Coast ports—especially the Port of Long Beach. Lower import volumes benefitted port transit delays as the combination of the Panama drought and Middle East conflict had less impact at the top East and Gulf Coast ports. The March update of the logistics metrics Descartes is tracking shows that 2024 is starting off to be a strong year for U.S. container imports; however, global supply chain performance may be impacted throughout the year because of ongoing conditions at the Panama and Suez Canals and upcoming labor negotiations at U.S. South Atlantic and Gulf Coast ports.

U.S. container imports show strong growth.

February 2024 U.S. container import volumes decreased 6.0% from January 2024 to 2,137,724 twenty-foot equivalent units (TEUs) (see Figure 1). Versus February 2023, TEU volume was higher by 23.3%, and up 19.5% from pre-pandemic February 2019. There are several reasons for the sharp year-over-year increase that could overstate this February’s results. Leap year occurred in 2024, adding one day of capacity in February. In addition, Chinese Lunar New Year occurred on February 11 this year versus January 22 in 2023, so February 2024 saw no impact on U.S. imports from China while February 2023 did. To gain more clarity on the year-over-year performance, Descartes analyzed TEU volumes for the first 15 days in February of both years where there would be no impact from Chinese Lunar New Year. During this timeframe, the growth in container imports was 13.3%, which is much more representative. Overall, Figure 1 shows that the first two months of 2024 are more in line with the consumer-fueled pandemic growth.

A graph of different colored lines

Description automatically generated

Source: Descartes Datamyne™

“February 2024 was a strong month considering its brevity and continues the robust performance that started in January 2024,” said Chris Jones, EVP Industry and Services, Descartes. “The combined effect of the Panama drought and the conflict in the Middle East on transit times declined in February and volume for the Gulf Coast ports remained constant versus January.”

The March report is Descartes’ thirty-first installment since beginning its analysis in August 2021. To read past reports, learn more about the key economic and logistics factors driving global shipping performance, and review strategies to help minimize global shipping challenges, visit Descartes’ Global Shipping Resource Center.

shipping container cargo global trade logistics

China-US Container Leasing Rates Rise Threefold, Container Demand Recovery on the Horizon

The global shipping industry experienced a significant surge in rates over the past couple of months, as an aftermath of the Red Sea crisis. Three months into this crisis, container leasing rates on the China-US trade route have surged dramatically, rising by a staggering 223%, or threefold, compared to pre-incident levels. Additionally, demand for containers is expected to recover in the coming months as the US economy exhibits signs of resilience. 

The U.S. economy has exhibited resilience, with GDP rising at a 3.3% annual rate in the fourth quarter of 2023. This growth was fuelled by gains in consumer spending, non-residential fixed investment, exports, and government spending, among other factors. Furthermore, December’s personal income and spending reports reflected lower inflation and solid household spending, contributing to a positive economic outlook. 

Despite economic concerns, China is experiencing a surge in demand for ocean container freight to the United States.

The gains in consumer spending and retail sales figures suggest that our industry can expect decent demand recovery for goods, which translates into relatively higher container demand on the cards, as retailers restock inventory and fulfil consumer orders.” added Roeloffs. 

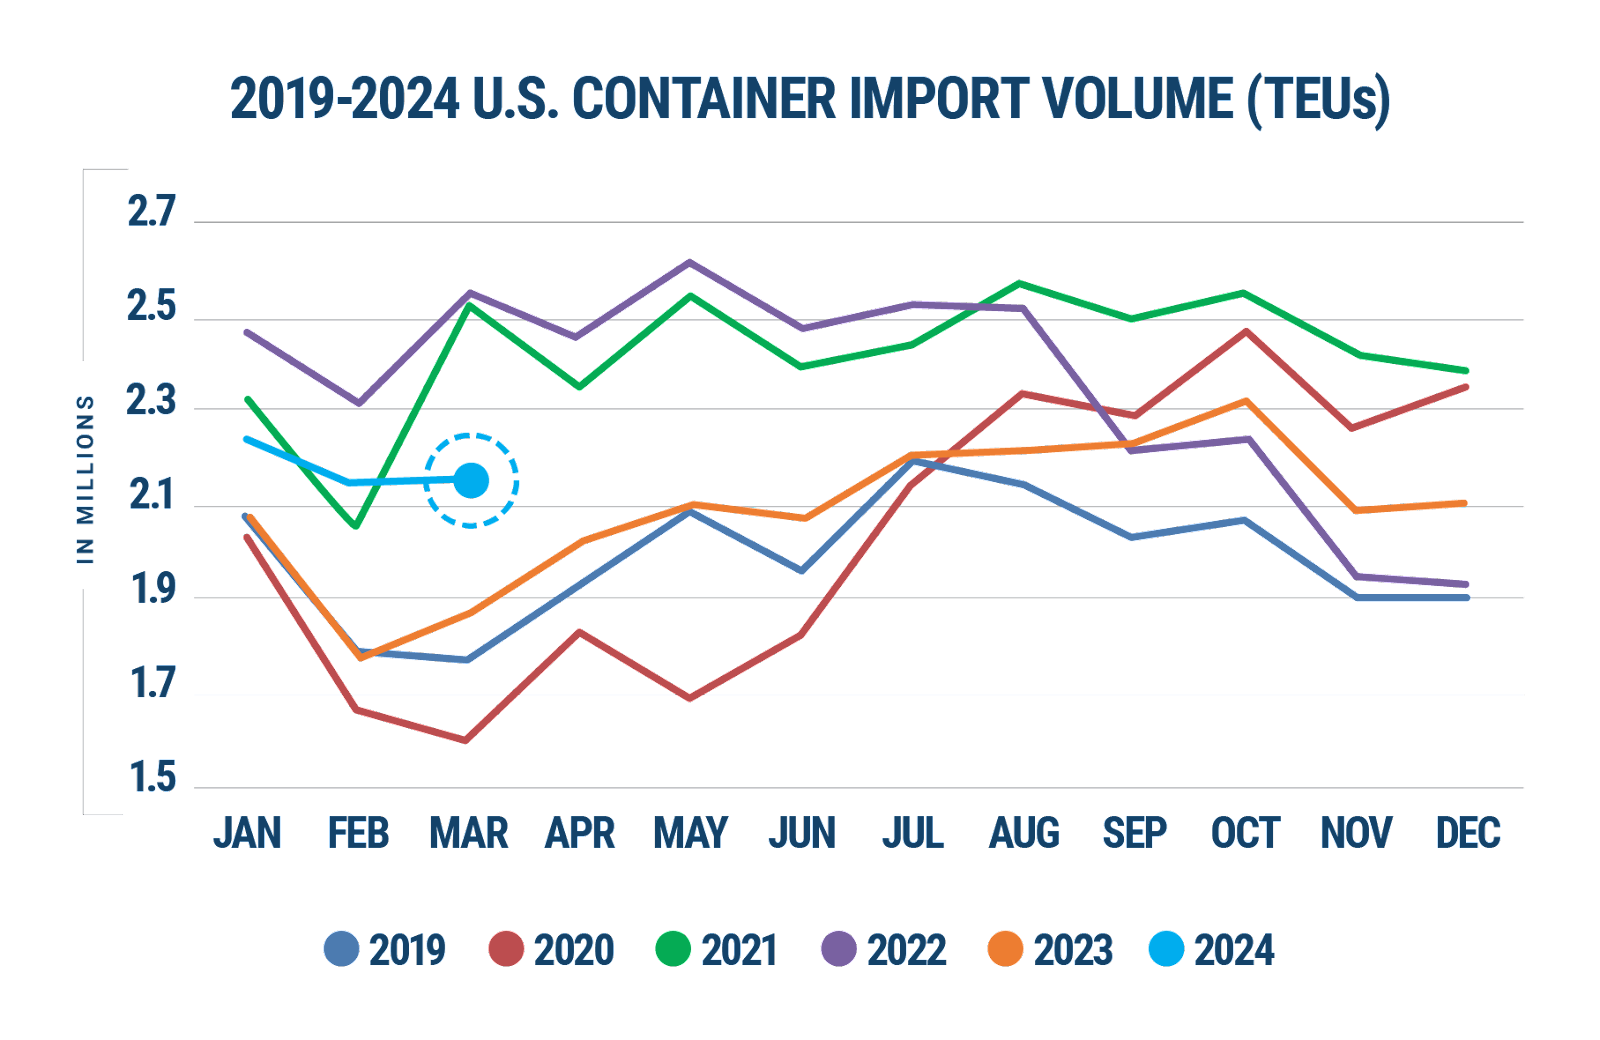
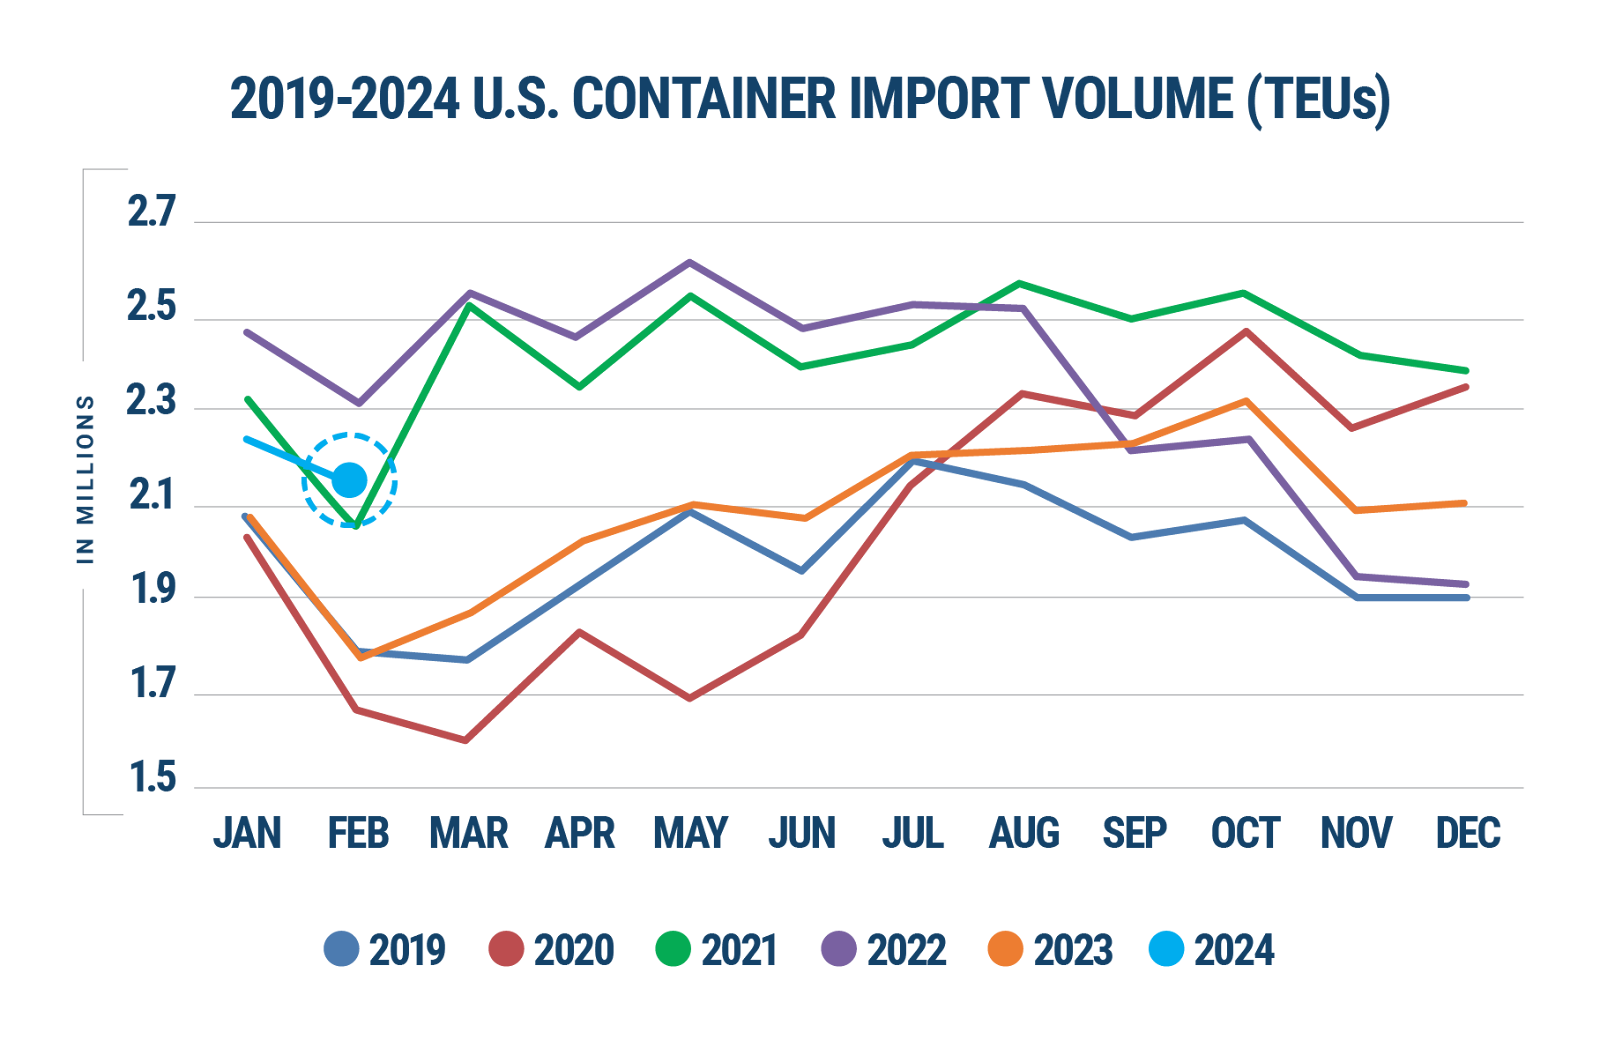
According to the Port of Los Angeles’ PortOptimizer, Week 6 TEU volumes were up 38.6% compared to the same week in 2023 (105,076 TEUs vs. 75,801 TEUs). 

One of the industry participant from a global logistics and freight forwarding company from California, United States shared with Container xChange as part of response to our regular polls around container price sentiment, “As attacks on cargo ships in the Middle East continue and vessels are rerouted around southern Africa, we anticipate equipment shortages due to the lack of container repositioning in Asia for eastbound goods. Furthermore, disruptions in the Suez, Red Sea passage, and Panama Canal will likely lead to increased demand for routing through the West Coast. Many importers are already rerouting cargo via West Coast transloading and trucking across to the coast, adding pressure on railways and domestic carriers. We advise all clients to provide advanced forecasting, considering all routing options proactively, and determining the best course of action based on cargo readiness dates and required on-site dates.”

Another industry professional, a sales representative at a freight forwarding company in the US shared, “Our overseas offices have been reporting massive rate spikes, surging almost to COVID crisis-levels. I wouldn’t be surprised if those levels are reached by the middle of Q2.” 

While the prospects of better container demand in the rest of the year have improved, shippers are struggling with issues like container crunch in China, and 3X leasing rates on key trade routes. 

The price hike was especially pronounced on routes Ex China to key destinations like New York, NY and Los Angeles, CA in the United States. (See table below). To gain deeper insights into the cyclical fluctuations of container leasing rates that could have led by the pre-Chinese New Year surge, we conducted a comparative analysis with last year’s leasing rates in February 2023. Our findings reveal a stark contrast, as the magnitude of the current hike was not observed during the same period in February 2023.

* Note: Prices are rounded to the nearest dollar.

Table 1: Comparison of Container leasing rates (in dollars) Ex China to US East Coast and US West Coast Trade Routes: November 2023, February 2023, and February 2024 by Container xChange, an online container logistics platform for container trading and selling

The significant spikes in shipping rates over the last three months signal a notable shift in the supply-demand dynamics, with demand recovery and capacity being increasingly tied up as the transit times via the cape of good hope increase by 2 –3 weeks. While the pre-Chinese New Year surge contributed, it was the disruptions caused by the Red Sea rerouting that served as the primary catalyst for the shooting up of leasing rates for containers.” explained Christian Reoloffs, co-founder, and CEO of Container xChange.

Post Chinese New Year Freight rates expectation 

“Freight rates were somewhere around $2000 back in February 2023, last year. This year in 2024, these are at $3392 as on 9 February 2024. These prices last year continued to decline after the Chinese New Year by around 30% until March 2023. If we follow the cyclic trend, then a decline of a similar magnitude in the current freight rates will lead to the prices crashing from $3393 as on 2 February 2024 to $2300 in the coming weeks.” shared Christian Reoloffs, cofounder and CEO of Container xChange, an online container logistics platform for container trading and leasing. 

On the China to North America east Coast trade route, freight rates doubled between 15 December 2023 to 19 January 2024, (from around $2500 to roughly $5000). 

Shipping lines and carriers may benefit from higher leasing rates in the short term. However, in the long run, if these elevated costs are maintained, it can increase the cost of exporting goods, potentially squeezing profit margins for manufacturers and exporters. They may need to pass these increased costs onto consumers, leading to higher prices for imported goods.

Container Leasing Rates on China-US trade route

The chart below illustrates a sharp increase in leasing rates from China to the West Coast ports of the United States, particularly Los Angeles and Long Beach, in 2024. In December 2023, prices ranged from $280 to $776 for Los Angeles and $370 to $710 for Long Beach.

However, prices surged in January 2024, with rates to Los Angeles ranging from $740 to $920 and to Long Beach from $700 to $920. This trend continued into February 2024, with rates to Los Angeles reaching $1070 to $1230.

Chart 1: Average One-way leasing rates Ex China to USWC ports

Chart 2: Average One-way leasing rates Ex China to USEC ports

Prices for shipping containers from China to New York and Savannah, GA ranged from $400 to $820 and $590 to $1043, respectively, in September to December 2023. In January, prices rose notably, with rates to New York ranging from $608 to $1008 and to Savannah from $706 to $733. Prices continued to rise in February, with rates to New York reaching $1290 to $1730.

China to New York rates more than doubled from December 2023 to February 2024, while rates for shipping containers to Los Angeles increased by nearly $435 during the same period.

To read similar analysis, reports and indices, visit Container xChange’s Market Intelligence hub

port congestion import

February U.S. Container Import Volumes Up 7.9% from December Driven by Chinese Imports

Descartes Systems Group, the global leader in uniting logistics-intensive businesses in commerce, released its January Global Shipping Report for logistics and supply chain professionals. In January 2024, U.S. container import volume increased 7.9% from December 2023—the largest month-over-month growth for January in the last seven years. A 14.9% rise in imports from China fueled the gains with the Ports of Los Angeles and Long Beach getting most of it. The combination of the Panama drought and Middle East conflict is beginning to impact transit times as delays at the top East and Gulf Coast ports increased considerably. The February update of the logistics metrics Descartes is tracking shows accelerated container import volume amid signs that global supply chain performance could be impacted throughout 2024 because of conditions at the Panama and Suez Canals and upcoming labor negotiations at U.S South Atlantic and Gulf Coast ports. 

January 2024 U.S. container import volumes increased 7.9% from December 2023 to 2,273,125 twenty-foot equivalent units (TEUs) (see Figure 1). Versus January 2023, TEU volume was higher by 9.9%, and up 9.6% from pre-pandemic January 2019. 

Figure 1. U.S. Container Import Volume Year-over-Year Comparison

 Source: Descartes Datamyne™

“January was another solid month driven by surprisingly strong imports from China,” said Chris Jones, EVP Industry and Services, Descartes. “The combined effect of the Panama drought and the conflict in the Middle East is beginning to impact transit times, particularly at the top East and Gulf coast ports.” 

The December report is Descartes’ thirtieth installment since beginning its analysis in August 2021. To read past reports, learn more about the key economic and logistics factors driving the global shipping crisis, and review strategies to help address it in the near-, short- and long-term, visit Descartes’ Global Shipping Resource Center.

workforce shortages global trade trax softeon operations

Transportation & Warehouse Operations Most Challenged by Resource Shortages

Descartes Systems Group, the global leader in uniting logistics-intensive businesses in commerce, released findings from its study How Bad Is the Supply Chain and Logistics Workforce Challenge?, which indicates that 76% of the supply chain and logistics leaders surveyed are experiencing notable workforce shortages in their operations. What’s more, 37% of respondents would characterize the resource shortage they face as high to extreme. While the issue is affecting companies’ financial, peak season and logistics partner performance, the survey also showed it’s taking a toll on customer service performance, with 58% specifying that workforce shortages have negatively impacted service levels.

While the competition for supply chain and logistics resources is widespread, how acute the workforce challenge varies by organizational function. According to survey results, the areas suffering the most from resource shortages were transportation operations (61%) and warehouse operations (56%). While these areas are admittedly highly labor-intensive, findings also revealed that 55% of supply chain and logistics leaders said knowledge workers are the hardest to hire—and they are becoming increasingly important as supply chain and logistics operations become more technology-enabled and data-driven.

“With economies cooling and COVID more manageable, the general thinking has been that companies would see the workforce shortages of the past few years subside; however, this does not appear to be the case,” said Chris Jones, EVP, Industry at Descartes. “The study shows that, post-pandemic, supply chain and logistics organizations continue to struggle getting the labor, knowledge workers and leaders they need to thrive. With business performance driven by both the quantity and quality of the workforce, supply chain and logistics leaders need to rethink not just their hiring and retention strategies but also how technology can help to mitigate current and future workforce challenges.”

Results also showed that the impact of workforce shortages varies by financial performance, growth, management’s perceived importance of supply chain and logistics operations, and by how successful employee retention programs are. There’s evidence that business performance is interrelated—and that the impact of workforce shortages can be mitigated by business leaders understanding the full potential of their supply and logistics operations and why employee retention is so critical to supply chain and logistics performance.

Descartes and SAPIO Research surveyed 1,000 supply chain and logistics decision-makers in late 2023 across three sectors:

a) manufacturing, distribution and retail;

b) carriers; and

c) logistics services providers.

The goal was to understand the nature of any workforce shortages they were facing and the impact of resource constraints on their operations and business success. Respondents were based across nine European countries, Canada and the United States, and held Owner, C-Suite, Director and Manager-level positions in their respective organizations. Learn more about the How Bad Is the Supply Chain and Logistics Workforce Challenge? survey results.

baltimore import mach electronic shipping route import 7LFreight Expands Instant Cargo Pricing and Booking for North American Forwarders Across Both Air and Trucking  import container descartes automation baltimore bridge container freight global trade

November Sees 9% Drop in US Container Imports; Panama Drought Affects East and Gulf Coast Ports

Descartes Systems Group (Nasdaq: DSGX) (TSX:DSG), the global leader in uniting logistics-intensive businesses in commerce, released its December Global Shipping Report for logistics and supply chain professionals. In November 2023, U.S. container import volume decreased 9% from October 2023, with East and Gulf Coast ports experiencing the greatest declines. While the decrease is large, it’s consistent with monthly reductions at the end of prior years. Imports from China also continued to decline, but at a slightly faster pace than the overall numbers. The Panama drought finally appears to be negatively impacting U.S. container import volume at East and Gulf Coast ports, which could worsen with the Panama Canal Authority’s plans to further reduce the number of daily transit slots in coming months. The December update of the logistics metrics Descartes is tracking shows a decline consistent with seasonal import patterns and signs that global supply chain performance improvements have stalled.

November 2023 U.S. container import volumes decreased 9.0% from October 2023 to 2,099,408 twenty-foot equivalent units (TEUs) (see Figure 1). Versus November 2022, TEU volume was higher by 7.4%, and up 10.4% from pre-pandemic November 2019. The growth in import volume over the first eleven months of 2023 is within 4.0% of the same period in 2019.

Figure 1. U.S. Container Import Volume Year-over-Year Comparison

Source: Descartes Datamyne™

“November has traditionally been a weaker month than October and while the decline is steep, it is consistent with other years’ performance,” said Chris Jones, EVP Industry at Descartes. “The impact of the drought in Panama is finally hitting as volumes at the Gulf Coast ports (see Figure 2) and, in particular, the port of Houston(-26.7%) are considerably lower than the overall decline. East Coast ports experienced a significant decrease as well.”

Figure 2: U.S. Gulf Coast Container Imports for 2023

Source: Descartes Datamyne™

The November report is Descartes’ twenty-eighth installment since beginning its analysis in August 2021. To read past reports, learn more about the key economic and logistics factors driving the global shipping crisis, and review strategies to help address it in the near-, short- and long-term, visit Descartes’ Global Shipping Resource Center.

trade recession supply chain freight peak descartes

Descartes Releases September Global Shipping Report: August U.S. Container Import Volumes Increase Slightly from July and Continue to Track 2019 Performance

Descartes Systems Group (Nasdaq: DSGX) (TSX:DSG), the global leader in uniting logistics-intensive businesses in commerce, released its September Global Shipping Report for logistics and supply chain professionals. In August 2023, U.S. container import volume increased slightly compared to July 2023, which is fairly consistent with the pattern that occurs in peak season in non-pandemic years. Despite the volume increase, port transit times remained close to their lowest levels since Descartes began tracking them. The U.S. West Coast labor situation is resolved. While the Panama drought is impacting some types of shipping, U.S. container imports do not appear to be affected to date. The September update of the logistics metrics Descartes is tracking shows continued consistency with 2019 results and signs that key challenges to global supply chain performance in 2023 have stabilized.

August 2023 U.S. container import volumes increased 0.4% from July 2023 to 2,196,268 twenty-foot equivalent units (TEUs) (see Figure 1). Versus August 2022, TEU volume was lower by 13.2%, but up 2.5% from pre-pandemic August 2019. The growth in import volume over the first eight months of 2023 is within 2.1% of the same period in 2019.

Figure 1. U.S. Container Import Volume Year-over-Year Comparison

Source: Descartes Datamyne™

“In August, U.S. import container volume flattened and is still relatively consistent with the peak season patterns we would see pre-pandemic,” said Chris Jones, EVP Industry Descartes. “While the drought in Panama is affecting some shipping traffic, U.S. container import volumes do not appear to be impacted as volumes at the Gulf ports over the last two months have been at their highest levels this year (see Figure 2) and transit times have been consistently low.”

Figure 2: U.S. Gulf Coast Container Imports for 2023

Source: Descartes Datamyne™

The September report is Descartes’ twenty-fifth installment since beginning its analysis in August 2021. To read past reports, learn more about the key economic and logistics factors driving the global shipping crisis, and review strategies to help address it in the near-, short- and long-term, visit Descartes’ Global Shipping Resource Center.

descartes

Crafter’s Companion Improves Fulfilment Efficiency by 25% and Reduces Error Rate to Less Than 1% with Descartes Ecommerce Warehouse Solution

Descartes Systems Group, the global leader in uniting logistics-intensive businesses in commerce, announces that international craft retailer Crafter’s Companion has implemented Descartes’ cloud-based ecommerce warehouse management solution (WMS) to improve the efficiency of its warehouse operations. In addition to realizing higher customer satisfaction as a result of faster order processing, the company’s error rate in fulfilment has dropped significantly by increasing the accuracy of its existing pick and pack process using barcode-based scanning processes.

“At Crafter’s Companion, our customers are at the heart of everything we do and being a dynamic and agile business allows us to deliver solutions that really benefit our customers. With the new solution, we have achieved a 25% increase in fulfilment efficiency with an error rate of less than 1%,” said Mark Allsop, CEO of Crafter’s Companion. Sara Davies, founder and creative director of Crafter’s Companion, added: “We’re thrilled to be working with Descartes and implementing its ecommerce WMS in our global, 54,000 sq ft distribution center is an important milestone for the business. The software is helping us operate to our full potential, as we continue to service our amazing worldwide community of customers.”

Part of Descartes’ ecommerce solution suite, the Descartes ecommerce WMS helps direct-to-consumer brands and ecommerce retailers drive significant efficiencies across order fulfilment processes to provide a remarkable customer experience. The solution helps ensure that retailers can ship on time, ship the right items, not oversell existing inventory, and have full transparency into warehouse operations. The solution is pre-integrated with major ecommerce platforms, such as ChannelAdvisor, Shopify Plus, Brightpearl and others, to accelerate implementation and time to value. Order information is automatically available to be executed via mobile-driven multi-order pick-and-pack strategies and then fed into Descartes and third-party parcel shipment systems.

“We’re proud to enable Crafter’s Companion to pursue its global growth strategy with scalable processes and highly accurate fulfilment operations,” said Dirk Haschke, VP & General Manager, Ecommerce at Descartes. “The company’s focus lies on its customers’ satisfaction and by ensuring efficient intralogistics processes, Descartes’ ecommerce WMS helps to fulfil the promises made.”

trade

The Shifting US-China Trade Landscape 

In the wake of pandemic-driven supply chain disruptions, U.S. trade flows are realigning, shifting away from overreliance on China as American companies move to diversify sourcing channels to mitigate risk. During the pandemic, U.S. firms experienced firsthand the disastrous effects of concentrating their supply chains in one geographic area or with single suppliers. While the Covid impact on the supply chain has waned, companies are facing other challenges to the flow of goods, from the increasing frequency of climate-related disruptions to sanctions repercussions stemming from China’s human rights abuses in Xinjiang.

Ongoing trade tensions between China and the U.S. also continue to impact the movement of goods. Beginning in 2018, the previous administration rolled out tariffs on over $350 billion worth of Chinese imports, prompting American companies to buy similar goods from companies in countries not impacted by the tariffs—especially for products like semiconductors, furniture, IT hardware, and some consumer electronics. These tariffs affected approximately 18% of imports into the U.S., equivalent to 2.6% of GDP, and increased costs for about two-thirds of dutiable products across multiple industries. 

From nearshoring and reshoring to the sourcing shift to other countries, U.S. companies are seeking to mitigate supply chain risk moving forward. While China remains the dominant Country of Origin (CoO) for many of the top 10 commodity groups imported by the U.S., the country has been slowly losing its share of U.S. container import volume. 

SHIFTING TIDES

Looking back over the past 20 years of trade data, China’s share of container import volumes into the U.S. peaked in 2010 at 44.5% (50.1% including Hong Kong) (Figure 1). The country’s share was relatively stable from 2011 to 2017 and then peaked again in 2018. The 2018 peak, however, was heavily influenced by the previous U.S. administration imposing duties on select goods, causing importers to expedite shipments into the U.S. to avoid paying the incremental import fees. 

Figure 1: China’s Share of U.S. Container Imports

Source: Descartes Datamyne™

 From 2019 through to the first five months of 2023, China’s import share declined to 35.8%. Hong Kong also saw a decrease in container imports over the last 20 years, with its share peaking at 11.7% in 2004 and falling to 2.3% in the first five months of 2023. 

A VIEW INTO TOP 10 IMPORTS

A recent report from Descartes drilled down into the global trade data, analyzing the top 10 container import goods categories—by 2-digit Harmonized System (HS) codes—from 2016 to 2022 and the related top 10 CoOs for each category to examine shifts in trade volumes and the impact on TEU import share. (Note: from a historical perspective, mainland China is measured separately from Hong Kong in the analysis.)

For the top 10 goods categories during the period from 2016 to 2022, China experienced:

  • Two that grew and increased share,
  • Five that grew but lost share,
  • Two that declined in growth and share, and 
  • One that declined and dropped out of the top 10 CoO. 

Despite the rise of imports from other countries, China remained the dominant CoO in eight of the top 10 goods categories. South and Southeast Asian countries, such as Vietnam, India, Bangladesh, Thailand and Indonesia, however, usurped import share from China, having built capacity in a number of goods categories driving market share to climb across several categories—with some growing significantly faster than the overall market. 

DIVERSIFYING SUPPLY CHAINS 

An analysis of individual HS categories highlights where there has been a shift away from reliance on China, as U.S. importers begin to diversify their supply chains to find alternate sources for raw materials and finished goods. For example, between 2016 and 2022, the goods category HS-94 (Furniture, Bedding, Lighting, etc.) grew 42.8% overall in TEU import volume (Figure 2). Despite this growth, imports from China increased by only 5%, while Vietnam’s import volume grew a hefty 186.3% during the same seven-year period. Looking at market share, China’s share decreased 17.3% to 47.6% and Vietnam’s share expanded, increasing 12.4% to 24.7% from 2016 to 2022. Notably, imports from Vietnam were one-fifth of China’s volume in 2016, rising to half by 2022.

Vietnam was not the only Southeast Asian country making gains exporting products such as garden furniture, ironing boards and bedspreads in the HS-94 trade category. Starting in 2018 and continuing through 2021, other South and Southeast Asian countries, such as India (+198.6%), Indonesia (+139.6%) and Malaysia (+69.3%), experienced accelerated TEU import growth, albeit from a smaller base, with Thailand and Cambodia displacing Poland and Macau from the top 10 list. 

Figure 2: Top 10 CoO Analysis for HS-94

Source: Descartes Datamyne™

A similar trend occurred in the HS-85 goods category (Electronic Machinery, Sound Recorders, TV Equipment, etc.). While TEU import volume of products such as transformers, AC generators and batteries increased 34.8% overall between 2016 and 2022 (Figure 3), Vietnam demonstrated phenomenal growth of 556.3%, rising from the eighth to the second-largest CoO in this category. By contrast, imports from China increased only 12% and its share slipped 9.5% to 46.7% in the same period.

Thailand (+72.5%) and South Korea (+52.6%) also experienced strong container import growth, with India displacing the Philippines in the top 10 CoOs. The accelerated growth for Vietnam began in 2019 and continued through 2022, for Thailand in 2020, and for South Korea in 2020 through 2022.

Figure 3: Top 10 CoO analysis for HS-85

Source: Descartes Datamyne™

FINAL THOUGHTS

Given recent moves by the current administration to strengthen American supply chains and limit business flow with China—including the CHIPS and Science Act and the Inflation Reduction Act which funnel hundreds of billions of dollars into development of leading-edge technology and domestic manufacturing capacity—and unprecedented export controls aimed at China’s semiconductor and advanced computing industry—trade tensions with China is showing no signs of letting up.

Bracing for ongoing trade volatility, U.S. companies are seeking to create risk-resistant supply chains that provide greater flexibility in response to disruption. While sourcing shifts to alternate countries are underway for many different types of goods, decreasing China’s share of imports and dampening its growth, China remains the dominant CoO for many of the top 10 commodity groups imported by the U.S., as the country looks to maintain its production capacity and stay a significant source. 

consumers New DHL service organizes last-mile deliveries for ecommerce shipments of export cargo and import cargo in international trade. autonomous

Descartes’ Study Reveals 60% of Consumers Quite/Very Interested in Sustainable Home Delivery Services

Descartes Systems Group (Nasdaq: DSGX) (TSX:DSG), the global leader in uniting logistics-intensive businesses in commerce, released findings from its 2023 Home Delivery Sustainability Report: Consumers Expect More! survey, which examined consumer sentiment of retailers’ sustainability practices around their delivery operations. The survey found that only 43% of consumers felt retailers were doing a good job of using sustainable delivery practices. Over 60%, however, indicated they were quite/very interested in environmentally friendly delivery methods. Additionally, 59% said they are willing to act if they’re not satisfied with retailers’ sustainable delivery efforts.

The study of 8,000 consumers across nine European countries, Canada and the United States provides retailers and logistics organizations with critical insights into the importance of sustainability in consumer purchase and delivery decisions and how perspectives vary by age and geography.

“Compared to our 2022 study, consumers are much more interested in the environmental delivery practices of retailers. They’re influenced by these factors when making purchasing decisions and willing to take eco-friendly home delivery options, which are often also lower cost delivery methods for retailers,” said Chris Jones, EVP, Industry at Descartes. “Retailers need to heed these important trends as they provide more ways to differentiate, grow revenue, create greater customer loyalty and reduce delivery costs.”

The study analyzes consumer sentiment around the sustainability of retailers’ delivery operations, how this is impacting purchasing decisions, how consumers evaluate retailer efforts in sustainable delivery, which goods are most impacted by sustainable delivery performance and how consumers want to receive goods. In addition, it delves into the changes in purchasing and delivery decisions that consumers are willing to make to help the environment. Lastly, it provides insight into how the importance of sustainable delivery varies by geodemographic factors, the influence of geodemographics on buyer behavior, the delivery decisions consumers are making, and consumer expectations of retailers’ sustainable delivery efforts for the future. To learn more, read the 2023 Home Delivery Sustainability Report: Consumers Expect More! report.

Learn more about Descartes’ environmental practices at Environmental Impact | Descartes.