


The COVID-19 pandemic has precipitated a mass exodus of people from dense, expensive cities to less crowded, affordable areas. A recent survey conducted by The Harris Poll found that 39 percent of urban Americans are considering moving to a less crowded location as a result of the pandemic. This shift in attitude follows a long period of urbanization that began during the Industrial Revolution and continued through the beginning of 2020.

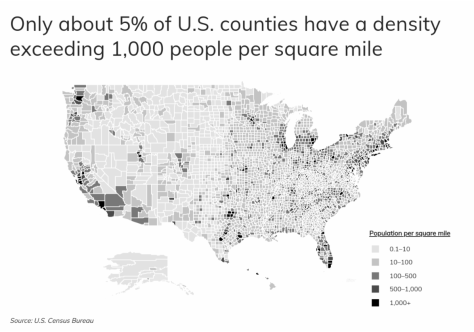
Despite most Americans living in high-density areas, the overall population density in the U.S. is relatively low, at under 100 people per square mile. In fact, only about 5 percent of U.S. counties have a population density that exceeds 1,000 people per square mile. Most of these high-density counties are located in coastal states such as Virginia, New Jersey, New York, and California. Low-density areas are scattered throughout the country, with the lowest population densities observed in the North Central and Mountain regions.
While rural living might be attractive for some, many Americans are simply looking for less crowded alternatives to some of the most densely populated areas like New York City (27,954 per square mile), San Francisco (18,828 per square mile), and Boston (14,396 per square mile). For reference, the median population density of America’s 324 largest cities with over 100,000 residents is just 3,419 per square mile, about 80 percent less crowded than New York City.
For families seeking a less crowded place for health and safety reasons, but also wanting to maintain a comparable salary, there are several locations to consider, especially in the South and the Midwest. To find which low-density cities pay the best, researchers at Roofstock, a real estate investment platform, analyzed data from the U.S. Census Bureau for cities with over 100,000 residents.
The researchers first identified cities with population densities that fell below the median of 3,419 people per square mile. Then the researchers ranked the remaining cities by their respective median annual earnings for full-time workers. In the event of a tie, the city with the higher median earnings for all workers was ranked higher. To improve relevance, cities were further grouped into the following cohorts based on population size: small (100,000–149,999), midsize (150,000-349,999), and large (350,000 or more).
Here are the top-paying large U.S. cities with low population densities.

For more information, a detailed methodology, and complete results, you can find the original report on Roofstock’s website: https://learn.roofstock.com/


