


The Shifting US-China Trade Landscape

In the wake of pandemic-driven supply chain disruptions, U.S. trade flows are realigning, shifting away from overreliance on China as American companies move to diversify sourcing channels to mitigate risk. During the pandemic, U.S. firms experienced firsthand the disastrous effects of concentrating their supply chains in one geographic area or with single suppliers. While the Covid impact on the supply chain has waned, companies are facing other challenges to the flow of goods, from the increasing frequency of climate-related disruptions to sanctions repercussions stemming from China’s human rights abuses in Xinjiang.
Ongoing trade tensions between China and the U.S. also continue to impact the movement of goods. Beginning in 2018, the previous administration rolled out tariffs on over $350 billion worth of Chinese imports, prompting American companies to buy similar goods from companies in countries not impacted by the tariffs—especially for products like semiconductors, furniture, IT hardware, and some consumer electronics. These tariffs affected approximately 18% of imports into the U.S., equivalent to 2.6% of GDP, and increased costs for about two-thirds of dutiable products across multiple industries.
From nearshoring and reshoring to the sourcing shift to other countries, U.S. companies are seeking to mitigate supply chain risk moving forward. While China remains the dominant Country of Origin (CoO) for many of the top 10 commodity groups imported by the U.S., the country has been slowly losing its share of U.S. container import volume.
SHIFTING TIDES
Looking back over the past 20 years of trade data, China’s share of container import volumes into the U.S. peaked in 2010 at 44.5% (50.1% including Hong Kong) (Figure 1). The country’s share was relatively stable from 2011 to 2017 and then peaked again in 2018. The 2018 peak, however, was heavily influenced by the previous U.S. administration imposing duties on select goods, causing importers to expedite shipments into the U.S. to avoid paying the incremental import fees.
Figure 1: China’s Share of U.S. Container Imports
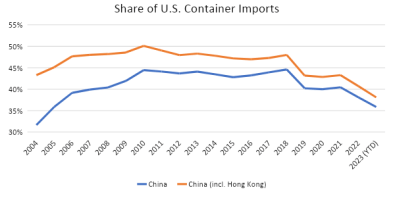
From 2019 through to the first five months of 2023, China’s import share declined to 35.8%. Hong Kong also saw a decrease in container imports over the last 20 years, with its share peaking at 11.7% in 2004 and falling to 2.3% in the first five months of 2023.
A VIEW INTO TOP 10 IMPORTS
A recent report from Descartes drilled down into the global trade data, analyzing the top 10 container import goods categories—by 2-digit Harmonized System (HS) codes—from 2016 to 2022 and the related top 10 CoOs for each category to examine shifts in trade volumes and the impact on TEU import share. (Note: from a historical perspective, mainland China is measured separately from Hong Kong in the analysis.)
For the top 10 goods categories during the period from 2016 to 2022, China experienced:
- Two that grew and increased share,
- Five that grew but lost share,
- Two that declined in growth and share, and
- One that declined and dropped out of the top 10 CoO.
Despite the rise of imports from other countries, China remained the dominant CoO in eight of the top 10 goods categories. South and Southeast Asian countries, such as Vietnam, India, Bangladesh, Thailand and Indonesia, however, usurped import share from China, having built capacity in a number of goods categories driving market share to climb across several categories—with some growing significantly faster than the overall market.
DIVERSIFYING SUPPLY CHAINS
An analysis of individual HS categories highlights where there has been a shift away from reliance on China, as U.S. importers begin to diversify their supply chains to find alternate sources for raw materials and finished goods. For example, between 2016 and 2022, the goods category HS-94 (Furniture, Bedding, Lighting, etc.) grew 42.8% overall in TEU import volume (Figure 2). Despite this growth, imports from China increased by only 5%, while Vietnam’s import volume grew a hefty 186.3% during the same seven-year period. Looking at market share, China’s share decreased 17.3% to 47.6% and Vietnam’s share expanded, increasing 12.4% to 24.7% from 2016 to 2022. Notably, imports from Vietnam were one-fifth of China’s volume in 2016, rising to half by 2022.
Vietnam was not the only Southeast Asian country making gains exporting products such as garden furniture, ironing boards and bedspreads in the HS-94 trade category. Starting in 2018 and continuing through 2021, other South and Southeast Asian countries, such as India (+198.6%), Indonesia (+139.6%) and Malaysia (+69.3%), experienced accelerated TEU import growth, albeit from a smaller base, with Thailand and Cambodia displacing Poland and Macau from the top 10 list.
Figure 2: Top 10 CoO Analysis for HS-94

A similar trend occurred in the HS-85 goods category (Electronic Machinery, Sound Recorders, TV Equipment, etc.). While TEU import volume of products such as transformers, AC generators and batteries increased 34.8% overall between 2016 and 2022 (Figure 3), Vietnam demonstrated phenomenal growth of 556.3%, rising from the eighth to the second-largest CoO in this category. By contrast, imports from China increased only 12% and its share slipped 9.5% to 46.7% in the same period.
Thailand (+72.5%) and South Korea (+52.6%) also experienced strong container import growth, with India displacing the Philippines in the top 10 CoOs. The accelerated growth for Vietnam began in 2019 and continued through 2022, for Thailand in 2020, and for South Korea in 2020 through 2022.
Figure 3: Top 10 CoO analysis for HS-85

FINAL THOUGHTS
Given recent moves by the current administration to strengthen American supply chains and limit business flow with China—including the CHIPS and Science Act and the Inflation Reduction Act which funnel hundreds of billions of dollars into development of leading-edge technology and domestic manufacturing capacity—and unprecedented export controls aimed at China’s semiconductor and advanced computing industry—trade tensions with China is showing no signs of letting up.
Bracing for ongoing trade volatility, U.S. companies are seeking to create risk-resistant supply chains that provide greater flexibility in response to disruption. While sourcing shifts to alternate countries are underway for many different types of goods, decreasing China’s share of imports and dampening its growth, China remains the dominant CoO for many of the top 10 commodity groups imported by the U.S., as the country looks to maintain its production capacity and stay a significant source.

Leave a Reply