


Cities With the Most Contact-Intensive Occupations

Social distancing measures used to help fight COVID-19 hit certain businesses and occupations especially hard. “Nonessential” occupations that require a high degree of face-to-face interaction—such as cosmetologists, bartenders, and athletic trainers—have been the most vulnerable throughout the pandemic, with large swaths of workers in these fields facing reduced hours or unemployment.
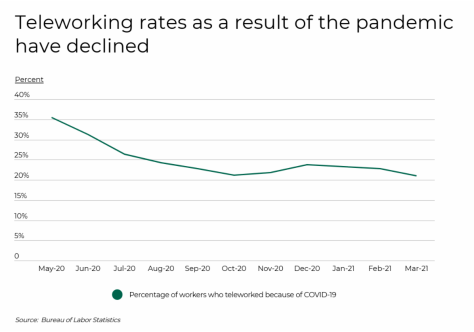
On the other hand, essential workers in occupations with high levels of physical contact—for example, healthcare and logistics workers—have not experienced the same job losses, but have had to grapple with the increased risk of exposure to the virus. According to data from the Bureau of Labor Statistics (BLS) and the Occupation Information Network (O*NET), more than half of U.S. jobs require very close (near touching) or moderately close (at arm’s length) contact with others while at work. And while much of the economy has gone virtual, new data from the BLS shows that only about 20% of workers are currently teleworking because of the pandemic.
Despite an increasing number of industries transitioning online, jobs that depend on close proximity to others are generally not suitable for teleworking. Over 86% of healthcare practitioners and health care support workers are required to be in close contact with others. While telehealth services have increased dramatically during the pandemic, most healthcare workers have no other option but to work in an in-person setting. Other occupational groups requiring similar levels of close contact include food preparation and serving, personal care, and protective service. At the opposite end of the spectrum, less than a quarter of workers in legal, computer, math, business, finance, architecture, and engineering occupations work in close contact.

The share of workers in contact-intensive occupations varies geographically due to local industry makeup. To find the areas with the most contact-intensive occupations, researchers at Filterbuy analyzed the latest data from the BLS and O*NET to create a composite index based on the share of employment in different occupations and O*NET’s occupation-specific physical proximity scores. Researchers also calculated the percentage of workers in very close or moderately close contact with others, the percentage of workers in healthcare occupations, the percentage of workers in food preparation and serving jobs, and the median annual wage.
At the state level, Mississippi and South Carolina rank highest according to the composite index. About 60% of workers in Mississippi and 58% in South Carolina work in very close or moderately close contact with others. In general, states with higher concentrations of healthcare workers or higher concentrations of food preparation and serving jobs score highly on the index.

At the local level, similar patterns also hold true. To find the metropolitan areas with the most contact-intensive occupations, Filterbuy used the same methodology, but only included locations with at least 100,000 people. Additionally, metro areas were grouped into the following cohorts based on population size:
-Small metros: 100,000–349,999
-Midsize metros: 350,000–999,999
-Large metros: 1,000,000 or more
Here are the large metros with the most contact-intensive occupations.
| Metro | Rank | Composite index | Percentage of workers in very close contact with others | Percentage of workers in moderately close contact with others | Percentage of workers in healthcare occupations | Percentage of workers in food preparation and serving related | Median annual wage
|
|---|---|---|---|---|---|---|---|
| Miami-Fort Lauderdale-West Palm Beach, FL | 1 | 97.1 | 21.4% | 35.2% | 9.6% | 8.7% | $38,690 |
| Pittsburgh, PA | 2 | 97.1 | 23.2% | 33.2% | 13.6% | 7.7% | $43,200 |
| Las Vegas-Henderson-Paradise, NV | 3 | 96.9 | 23.3% | 37.9% | 8.7% | 12.7% | $37,690 |
| Philadelphia-Camden- |
4 | 94.8 | 22.7% | 32.6% | 13.5% | 6.9% | $46,500 |
| San Antonio-New Braunfels, TX | 5 | 94.7 | 23.3% | 35.0% | 11.6% | 10.0% | $37,920 |
| Riverside-San Bernardino- Ontario, CA | 6 | 94.4 | 23.1% | 36.6% | 11.2% | 9.0% | $39,630 |
| Providence-Warwick, RI-MA | 7 | 94.0 | 22.8% | 34.5% | 12.2% | 8.6% | $46,000 |
| Cleveland-Elyria, OH | 8 | 93.8 | 21.9% | 33.8% | 11.9% | 7.4% | $42,740 |
| Oklahoma City, OK | 9 | 93.7 | 21.8% | 34.9% | 10.4% | 10.0% | $39,080 |
| St. Louis, MO-IL | 10 | 93.4 | 22.2% | 33.3% | 12.0% | 8.4% | $42,060 |
| Milwaukee-Waukesha-West Allis, WI | 11 | 93.1 | 22.6% | 33.1% | 13.4% | 6.6% | $43,380 |
| Detroit-Warren-Dearborn, MI | 12 | 93.1 | 20.9% | 33.5% | 10.8% | 7.1% | $44,840 |
| New York-Newark-Jersey City, NY-NJ-PA | 13 | 92.3 | 22.5% | 32.1% | 12.8% | 6.2% | $52,020 |
| Cincinnati, OH-KY-IN | 14 | 92.3 | 20.8% | 34.2% | 10.0% | 8.4% | $41,660 |
| Birmingham-Hoover, AL | 15 | 91.7 | 22.0% | 35.1% | 11.6% | 8.3% | $39,530 |
| United States | – | 64.0 | 21.6% | 34.3% | 10.8% | 8.1% | $41,950 |
For more information, a detailed methodology, and complete results, you can find the original report on Filterbuy’s website: https://filterbuy.com/

Leave a Reply