


US Fed: A fata morgana hiking cycle?

In early January, the US Federal Reserve’s communications pointing to more hikes and an earlier balance sheet run-off, together with CPI reaching a yearly rate of 7% in December, have triggered a surge in long-term US yields. Over a short span of two weeks, US 10y Treasuries yields rose 24bp from 1.5% to 1.75% and temporarily reached 1.9% (Figure 1).
Figure 1: Evolution of US 10y Treasury yield (last 2 months).

In total return, this was the largest decline of 10Y US Treasuries over the last four decades. Only in February 1980, when Chairman Volcker raised the Fed Funds rate to 21% did long-term US Treasuries have a worst two-week performance, and this was against the background of much lower growth than today. For some, this is enough to (once again) claim the switch to a new regime, where “low for longer” is replaced by rising yields, driven by higher inflation uncertainty and growing interest rate risk. For us this view reflects mostly tactical noise rather than the underlying dynamics of recent yield movements. Over the recent days, US 10y Treasury yields have consolidated again at 1.74%.
Bonds markets seem have become more confident about the near-term US recovery rather than worry about incipient stagflation. The components of US nominal yields show that the recent increase was not caused by the risk component (term premium) but by a higher expected nominal short-term rate. The inflation expectations embedded in this rate remain stable, but the implied expectations for the real rate have risen (real short-term rate). The real short-term rate is closely linked to the economic outlook. In other words, the recent yield movement can be explained by increasing confidence among market participants that the upcoming Fed rate hikes (four hikes are currently priced in for this year) are appropriate and will not derail real growth. However, residual skepticism remains. The risk premium associated with the real short-term rate (real term premium) remains negative indicating limited potential for higher longer-term rates in a sustained growth cycle. Thus, we are not dealing with a risk surge, but with a re-rating of the growth scenario (Figure 2).
Figure 2: Decomposition of US 10y Treasury yield*

Don’t be fooled by real yields based on breakeven rates. From this growth story one could hastily derive a considerable upside potential for nominal yields especially in view of still clearly negative real yields (nominal yield – breakeven). But this is a flawed reading. The breakeven rate (derived from TIPS ) is not pure measure of inflation expectations and is subject to substantial market distortions. The US 10y breakeven rates – untypically – trade 50bp above their fair value due to a combination of lack of liquidity, high demand, and limited supply (Fed holding around 20% of the outstanding TIPS volume). Using the fair breakeven value (liquidity-adjusted) to calculate real yields, we see they are almost come back to pre-crisis levels (which is nearly the same as the sum of the real rate expectation and the real term premium in Figure 2 above). The US growth story is thus already priced in and provides very little upside for nominal yields (Figure 3).
Figure 3: Real yields back pre-crisis when adjusted for liquidity distortions*

However, changes in the duration of US Treasuries might provide some small upward pressure on the yield curve. Markets are also repricing the declining dampening stock effect of the Fed’s bond holdings on the US curve. With the upcoming quantitative tightening (QT), the share of duration-bearing securities in the private sector’s balance sheet is going to increase while short-term reserves are becoming scarcer. The additional duration supply translates into upwards pressure on yields. Currently, the QE-induced duration extraction is still dampening 10y US Treasuries by 130bp. With quantitative tightening we expect this effect to diminish by 20bps by the end of the year. However, a lower fiscal impulse than expected (e.g., if the Build-Back-Better framework does not pass) could also result in lower financing need by the US government and reduce the net supply of Treasuries, which could put downward pressure on yields and partly balance the effect from quantitative tightening.
The Fed might break the hiking cycle earlier than markets expect. The US monetary stance has undeniably become more hawkish. Given the tightening labor market, the expanded balance sheet and political pressure to fight inflation the risk reward of not tightening has indeed become too high. Cautious tightening can avoid overshooting inflation becoming embedded in expectations. However, the Fed also knows that tightening will not fight supply-side constraint-driven inflation. From this side, the pressure is going to ease over the year as we expect the inflationary pressure to abate. Our inflation tracker is already pointing at peak in Q1 2022 (Figure 4).
Figure 4: Inflation in the U.S. may peak in Q1 2022*

Sources: Refinitiv, Allianz Research
*US Inflation Tracker: equally weighted and normalized composite measure comprising 15 sub-segments (underlying trends (modified/trimmed measures), forecasts, market-based inflation measures, expected inflation implied by term structure models, monetary aggregates, consumer and producer price components, labor market indicators, commodity prices, corporate margin & profitability, and proxies for price effect from supply chain disruptions). Official measures: equally weighted and normalized composite measure comprising headline and core inflation reported by national authorities.
The normalization of the liquidity premium in the TIPS market, which should bring down breakeven rates, should also help to reduce the risk of de-anchoring inflation expectations. Instead of CPI and FOMC minutes, the focus of fixed income investors should lie on economic activity and monetary and financial conditions (MFC).

Financial markets signal a shortened cycle. The 2y10y steepness of the US curve is already very flat compared to earlier lift-off phases (75 bps vs an average of 120bps in the 2 months prior to lift-off). Looking at the swap forward curve, we can already see inversion patterns that previously only appeared in late phases of hiking cycles, usually 2 to 3 hikes before the peak (Figure 6). These signals are somewhat at odds with the aggressive pricing on the money market, where currently 6-7 hikes are priced for the next two years.

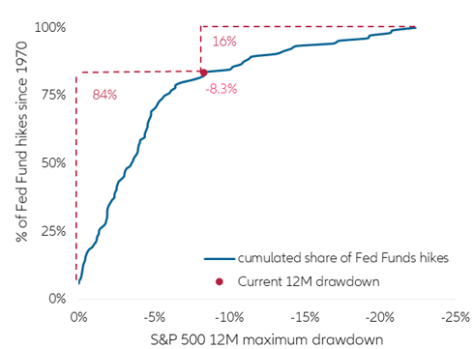
Equity market developments seem to confirm a shortened cycle. Over the last 50 years, 85% of the Fed rate hikes have taken place at a moment when the S&P 500 has experienced a 12-months drawdown of less than 10%. Today we are already at -8.3%. So, we are approaching an area where rate hikes are very rare (16% of all hikes). When they took place, it was mostly in the very late phase of the cycle (Figure 7). One can, of course, emphasize the uniqueness of this post-pandemic cycle and argue that the Fed should not care about equity markets. However, the past has shown that the suppression of risky asset volatility and preservation of the wealth effect feed into the reaction function. For us, behind the tactical noise signals are piling up that the biggest risk in the U.S. bond market might thus not come from the Fed falling behind the curve, but from many market participants positioning themselves too far ahead of the curve. Like the real economy went through a full cycle in less than 2 years, markets might go through monetary cycle without substantial hiking ever happening.
Figure 7: Fed rate hikes and S&P 500 12 Drawdown
Even in the long run US yields will remain subdued. It is difficult to imagine long-term rates reestablishing clearly above 3% on a sustained basis. We currently see the long-term (5 years ahead) nominal equilibrium interest rate in the U.S. at 2.6% of which 0.6% are attributable to the real neutral rate. This equilibrium rate could only shift substantially above 3% if we experience extreme monetary tightening or if massive government spending creates a permanent boost to potential GDP. For some, President Biden’s infrastructure plan could trigger such a GDP boost. However, to double the neutral rate relative to our baseline scenario, trend growth would have to reach around 3.5% (against currently 1.8%) without triggering a permanent surge in inflation. But the equilibrium rate could also reach 3% in a negative stagflation scenario.
Figure 8: US equilibrium rate scenarios for a 5-year horizon*

In that case, the driver would be permanently de-anchored inflation expectation (over 3%) while the neutral interest rate would decline as the growth potential is impaired. On a fundamental basis it is therefore hard to justify the regime shift narrative. It is much more likely that, behind all the current market noise, the low for longer regime will prevail (Figures 8 and 9)
Figure 9: Scenarios for US real neutral rate (r*) for a 5-year horizon


Leave a Reply