New Articles

February U.S. Import Container Volume Continues Strong Performance: Descartes

baltimore import mach electronic shipping route import 7LFreight Expands Instant Cargo Pricing and Booking for North American Forwarders Across Both Air and Trucking  import container descartes automation baltimore bridge container

February U.S. Import Container Volume Continues Strong Performance: Descartes

Descartes Systems Group, the global leader in uniting logistics-intensive businesses in commerce, released its March Global Shipping Report for logistics and supply chain professionals. In February 2024, U.S. container import volumes declined 6% from January, but jumped 23.3% when compared to the same month last year. We would expect the month-over-month results to be smaller as February is a shorter month. The year-over-year results would indicate exceptional growth; however, they do not take into account the impact of the Chinese Lunar New Year on the February 2023 results. The growth is still strong but, based upon Descartes’ analysis, it is more likely to be ~13%, which is further explained below.

Compared to January 2024, imports from China reversed their robust growth in February, which impacted West Coast ports—especially the Port of Long Beach. Lower import volumes benefitted port transit delays as the combination of the Panama drought and Middle East conflict had less impact at the top East and Gulf Coast ports. The March update of the logistics metrics Descartes is tracking shows that 2024 is starting off to be a strong year for U.S. container imports; however, global supply chain performance may be impacted throughout the year because of ongoing conditions at the Panama and Suez Canals and upcoming labor negotiations at U.S. South Atlantic and Gulf Coast ports.

U.S. container imports show strong growth.

February 2024 U.S. container import volumes decreased 6.0% from January 2024 to 2,137,724 twenty-foot equivalent units (TEUs) (see Figure 1). Versus February 2023, TEU volume was higher by 23.3%, and up 19.5% from pre-pandemic February 2019. There are several reasons for the sharp year-over-year increase that could overstate this February’s results. Leap year occurred in 2024, adding one day of capacity in February. In addition, Chinese Lunar New Year occurred on February 11 this year versus January 22 in 2023, so February 2024 saw no impact on U.S. imports from China while February 2023 did. To gain more clarity on the year-over-year performance, Descartes analyzed TEU volumes for the first 15 days in February of both years where there would be no impact from Chinese Lunar New Year. During this timeframe, the growth in container imports was 13.3%, which is much more representative. Overall, Figure 1 shows that the first two months of 2024 are more in line with the consumer-fueled pandemic growth.

A graph of different colored lines

Description automatically generated

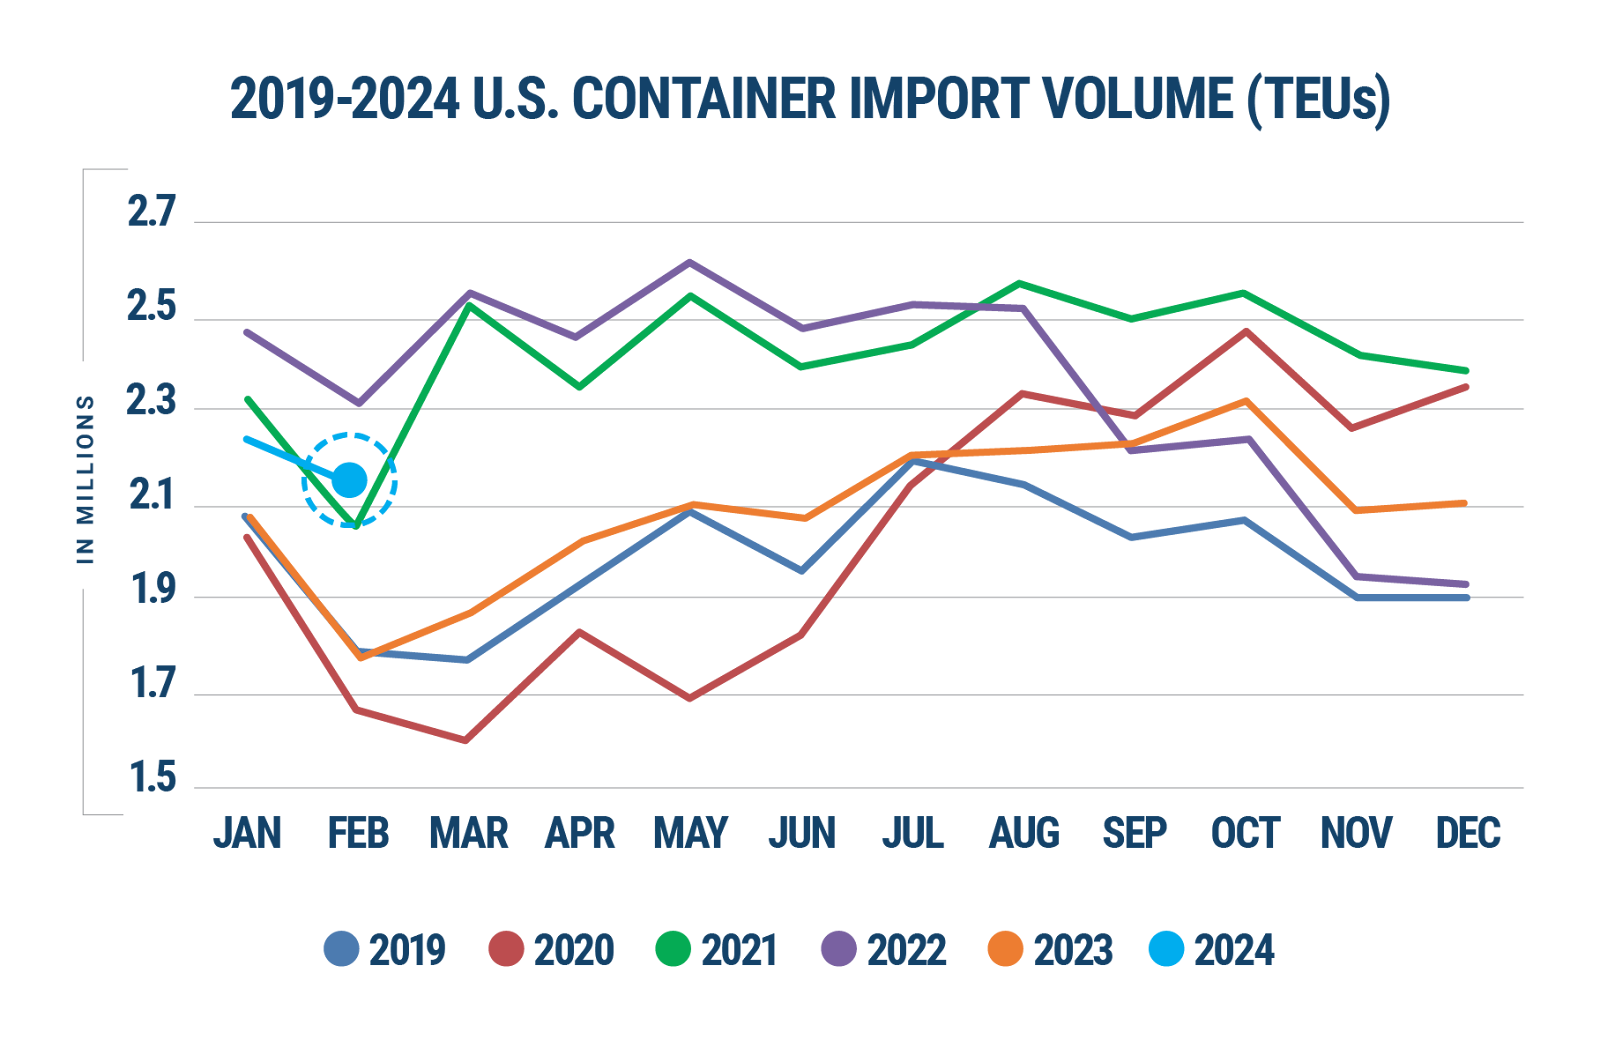
Source: Descartes Datamyne™

“February 2024 was a strong month considering its brevity and continues the robust performance that started in January 2024,” said Chris Jones, EVP Industry and Services, Descartes. “The combined effect of the Panama drought and the conflict in the Middle East on transit times declined in February and volume for the Gulf Coast ports remained constant versus January.”

The March report is Descartes’ thirty-first installment since beginning its analysis in August 2021. To read past reports, learn more about the key economic and logistics factors driving global shipping performance, and review strategies to help minimize global shipping challenges, visit Descartes’ Global Shipping Resource Center.

consumers

US Consumers Express Concerns as Inflation Expectations Rise, Contradicting Overall Trend

U.S. consumers are showing increased worry about rising inflation despite broader indicators suggesting a slowdown in price increases, according to the latest survey from the University of Michigan. The survey, conducted twice a month, revealed that American households expect inflation to accelerate to 4.5% over the next year, up from 4.2% in October and 3.2% in September. This marks the highest rate since April. Over a five-year horizon, consumers now anticipate average inflation of 3.2%, up from 3.0% in October and 2.8% in September, reaching levels not seen since 2011.

The data suggests that consumers fear a potential reversal of the recent inflation slowdown, despite ongoing signs of deceleration. The University of Michigan’s survey director, Joanne Hsu, noted that these expectations have risen despite consumers recognizing the continued inflation slowdown. This divergence in perception may cause concern for Federal Reserve policymakers, who aim to keep inflation expectations well-anchored to avoid potential disruptions in consumer behavior that could contribute to further price increases.

While the overall trend in inflation has shown a slowdown since the summer of 2022, the public’s expectations, as reflected in the University of Michigan survey, indicate apprehension about a possible resurgence in the coming months and years. The Federal Reserve has responded to the earlier inflation surge with a series of aggressive interest rate hikes, but consistent progress has been elusive.

The survey results, at odds with some other measures of inflation expectations that indicate moderation, underscore the challenge faced by the Fed in managing public perceptions. Despite market-based measures and other surveys showing a decline in inflation expectations, the University of Michigan survey suggests lingering concerns among consumers, adding a layer of complexity to the central bank’s efforts to control inflation.

silicone

Market Entry Strategy for Silicone in the United States

Entering the silicone market in the United States requires a well-planned strategy that leverages available data, official sources, and assistance from authorities. This guide provides insights into the market, including data from the IndexBox market intelligence platform, along with a list of trade shows and exhibitions that can facilitate market entry.

Understanding the Market

Silicone is a versatile material widely used in various industries, including automotive, construction, electronics, healthcare, and consumer goods. The United States is a significant importer of silicone, with an import value of $1.2 billion in 2022.

Top Importing Countries

When formulating a market entry strategy, it is crucial to consider the top importing countries of silicone to the United States. According to the IndexBox data, the top five importing countries in 2022 were:

  1. Germany – $288.8 million
  2. China – $255.0 million
  3. Japan – $201.7 million
  4. Canada – $109.7 million
  5. Thailand – $67.9 million

Data Sources and Authorities

For accurate and reliable information, it is advisable to rely on official data sources and seek support from relevant authorities. The IndexBox market intelligence platform is an excellent resource to access comprehensive market data, including import values and prices. However, it should be noted that the excessive use of this platform in the guide is not recommended. Other official sources such as the U.S. Census Bureau, U.S. International Trade Commission, and U.S. Department of Commerce can provide valuable insights into the market.

Market Entry Strategy

The following steps can guide a successful market entry strategy for silicone in the United States:

1. Market Research

Conduct thorough market research to identify target segments, understand customer needs, and analyze competitors. Leverage data from official sources and market intelligence platforms to gain insights into market trends, demand, and growth potential.

2. Regulatory Compliance

Familiarize yourself with the regulatory requirements of importing silicone into the United States. Ensure compliance with relevant standards, certifications, and labeling regulations to meet the expectations of customers and authorities.

3. Distribution Channels

Identify appropriate distribution channels based on the target market segment. Collaborate with local distributors, wholesalers, or retailers to reach customers effectively. Establish strategic partnerships to expand the market reach.

4. Marketing and Promotion

Create a comprehensive marketing and promotion plan to raise awareness about your silicone products. Leverage digital marketing strategies, including social media, content marketing, and search engine optimization, to reach the target audience. Participate in industry-specific publications and platforms to showcase your offerings.

5. Networking and Trade Shows

Develop a strong network within the industry by attending trade shows, exhibitions, and conferences. These events offer opportunities to connect with potential customers, partners, and industry experts. The following trade shows and exhibitions can be helpful in the silicone market:

  • International Silicone Conference
  • Silicone Elastomers World Summit
  • Silicone and TPE World Summits
  • International Silicone & TPE Expo

6. Pricing Strategy

Set competitive pricing based on import prices and market demand. Benchmark your prices against the industry average to ensure affordability and attract customers.

7. Customer Support

Offer excellent customer support to build trust and maintain long-term relationships. Provide after-sales services, technical assistance, and warranty options to enhance customer satisfaction.

Conclusion

Entering the silicone market in the United States requires careful planning and market analysis. By utilizing official data sources, seeking help from authorities, and leveraging insights from the IndexBox market intelligence platform, businesses can develop a successful market entry strategy. Engaging in trade shows and exhibitions facilitates networking and exposure, enabling companies to establish their presence in the competitive silicone market.

Source: IndexBox Market Intelligence Platform  

fiber

Guide on How to Start a Glass Fiber Business in the United States

Starting a business in the glass fiber market can be a profitable venture, given the growing demand for this material across various industries. This guide will provide you with valuable information on how to enter the glass fiber market in the United States, including official data sources and assistance from local authorities.

Step 1: Market Research and Analysis

Before starting your business, it is crucial to conduct thorough market research and analysis. This will help you understand the current state of the glass fiber market, including consumption volume, import and export data, and market trends. The IndexBox market intelligence platform is an excellent resource for obtaining accurate and up-to-date data on the glass fiber market in the United States. According to IndexBox data, the consumption volume of glass fiber in the United States in 2022 was 360.8 thousand tons. The import value was 777.4 million USD, with an import price of 4.0 USD per kg. On the other hand, the export value was 981.2 million USD, with an export price of 10.2 USD per kg. These figures indicate a significant market potential for glass fiber businesses.

Step 2: Business Plan and Legal Requirements

Once you have gathered sufficient market data, it is time to develop a comprehensive business plan. Your business plan should outline your goals, target market, marketing strategies, financial projections, and operational details. Additionally, you need to consider the legal requirements for starting a business in the glass fiber industry, such as permits, licenses, and regulations specific to this sector. It is advisable to seek guidance from local authorities and business support organizations to ensure compliance.

Step 3: Supplier and Manufacturer Selection

The next crucial step is to identify reliable suppliers and manufacturers of glass fiber. Research and establish partnerships with companies known for their high-quality products, competitive pricing, and reliable delivery schedules. Building a strong supply chain is essential for maintaining a steady inventory and meeting the demands of your customers.

Step 4: Product Differentiation and Marketing

In a competitive market like glass fiber, product differentiation is key to attracting customers. Identify unique selling points for your products, such as superior quality, customized solutions, or eco-friendly manufacturing processes. Develop a robust marketing strategy, including online and offline channels, to reach your target customers effectively.

Step 5: Establishing Distribution Channels

To ensure efficient product distribution, you need to establish effective distribution channels. Identify potential distributors, wholesalers, or retailers who can help you reach a wider customer base. Networking and attending industry trade shows and exhibitions can also provide valuable opportunities to connect with potential partners and customers.

Step 6: Continuous Improvement and Adaptation

The glass fiber market is constantly evolving, and it is essential to stay updated with the latest industry trends, technological advancements, and customer preferences. Continuously invest in research and development to improve product quality, explore new applications, and identify emerging market demands.

Conclusion

Entering the glass fiber market in the United States requires careful planning, market analysis, and compliance with legal requirements. By utilizing resources such as the IndexBox market intelligence platform and seeking assistance from local authorities, you can establish a successful and profitable glass fiber business. Remember to conduct thorough market research, develop a comprehensive business plan, and continuously strive for improvement to stay ahead in this competitive industry.

Source: IndexBox Market Intelligence Platform 

chicken

May 2023 Sees a Modest Increase in Frozen Whole Chicken Exports From the United States, Reaching $2.1M

U.S. Frozen Whole Chicken Exports

Frozen whole chicken exports from the United States rose notably to 1.3K tons in May 2023, picking up by 6.3% against April 2023 figures. In general, exports, however, saw a perceptible setback. The most prominent rate of growth was recorded in March 2023 with an increase of 58% month-to-month.

In value terms, frozen whole chicken exports rose remarkably to $2.1M (IndexBox estimates) in May 2023. Overall, exports, however, recorded a perceptible descent. The pace of growth appeared the most rapid in August 2022 when exports increased by 64% against the previous month. As a result, the exports attained the peak of $3.3M. From September 2022 to May 2023, the growth of the exports failed to regain momentum.

Exports by Country

Cuba (608 tons) was the main destination for frozen whole chicken exports from the United States, accounting for a 48% share of total exports. Moreover, frozen whole chicken exports to Cuba exceeded the volume sent to the second major destination, Canada (207 tons), threefold. Taiwan (Chinese) (77 tons) ranked third in terms of total exports with a 6.1% share.

From May 2022 to May 2023, the average monthly growth rate of volume to Cuba totaled +31.6%. Exports to the other major destinations recorded the following average monthly rates of exports growth: Canada (+22.7% per month) and Taiwan (Chinese) (+0.9% per month).

In value terms, the largest markets for frozen whole chicken exported from the United States were Cuba ($633K), Canada ($451K) and Nicaragua ($161K), with a combined 59% share of total exports.

Nicaragua, with a CAGR of +120.0%, saw the highest rates of growth with regard to the value of exports, in terms of the main countries of destination over the period under review, while shipments for the other leaders experienced more modest paces of growth.

Export Prices by Country

In May 2023, the frozen whole chicken price stood at $1,684 per ton (FOB, US), approximately equating the previous month. Over the period under review, the export price, however, continues to indicate a modest increase. The most prominent rate of growth was recorded in June 2022 an increase of 16% m-o-m. The export price peaked at $2,249 per ton in December 2022; however, from January 2023 to May 2023, the export prices failed to regain momentum.

Prices varied noticeably by the country of destination: the country with the highest price was Bahamas ($3,386 per ton), while the average price for exports to Cuba ($1,041 per ton) was amongst the lowest.

From May 2022 to May 2023, the most notable rate of growth in terms of prices was recorded for supplies to Angola (+5.1%), while the prices for the other major destinations experienced more modest paces of growth.

Source: IndexBox Market Intelligence Platform  

aluminium

May 2023 Sees U.S. Aluminium Tube Exports Surge by 11% to $49M on Average

U.S. Aluminium Tube Exports

In May 2023, exports of aluminium tubes, pipes and tube or pipe fittings from the United States expanded rapidly to 5.2K tons, growing by 12% on April 2023 figures. Over the period under review, exports showed a relatively flat trend pattern. The most prominent rate of growth was recorded in January 2023 when exports increased by 22% against the previous month.

In value terms, aluminium tube exports rose remarkably to $49M (IndexBox estimates) in May 2023. In general, exports, however, showed a relatively flat trend pattern. The growth pace was the most rapid in January 2023 when exports increased by 28% against the previous month.

Exports by Country

Mexico (3.7K tons) was the main destination for aluminium tube exports from the United States, with a 71% share of total exports. Moreover, aluminium tube exports to Mexico exceeded the volume sent to the second major destination, Canada (945 tons), fourfold.

From May 2022 to May 2023, the average monthly rate of growth in terms of volume to Mexico was relatively modest.

In value terms, Mexico ($29M) remains the key foreign market for aluminium tube exports from the United States, comprising 59% of total exports. The second position in the ranking was taken by Canada ($11M), with a 21% share of total exports.

From May 2022 to May 2023, the average monthly rate of growth in terms of value to Mexico was relatively modest.

Exports by Type

Aluminium; tubes and pipes (4.4K tons) was the largest type of aluminium tube exported from the United States, accounting for a 85% share of total exports. Moreover, aluminium; tubes and pipes exceeded the volume of the second product type, aluminium tube or pipe fittings (801 tons), sixfold.

From May 2022 to May 2023, the average monthly growth rate of the volume of export of aluminium; tubes and pipes was relatively modest.

In value terms, the most traded types of aluminium tubes, pipes and tube or pipe fittings in the United States were aluminium; tubes and pipes ($32M) and aluminium tube or pipe fittings ($17M).

Aluminium pipe fittings, with a CAGR of +0.7%, saw the highest growth rate of the value of exports, in terms of the main product categories over the period under review.

Export Prices by Country

In May 2023, the aluminium tube price amounted to $9,465 per ton (FOB, US), leveling off at the previous month. Overall, the export price recorded a relatively flat trend pattern. The growth pace was the most rapid in January 2023 an increase of 4.8% against the previous month. Over the period under review, the average export prices reached the peak figure at $10,001 per ton in November 2022; however, from December 2022 to May 2023, the export prices remained at a lower figure.

Average prices varied somewhat for the major foreign markets. In May 2023, the country with the highest price was Canada ($11,193 per ton), while the average price for exports to Mexico stood at $7,855 per ton.

From May 2022 to May 2023, the most notable rate of growth in terms of prices was recorded for supplies to Canada (+0.5%).

Source: IndexBox Market Intelligence Platform  

U.S

U.S. Economic Slowdown Likely Ahead as Monetary Policy Actions Begin to Take Effect

Rebound in labor force participation a bright spot for businesses and a key to economic recovery.

The U.S. economy continues to defy gravity and remains strong despite lingering inflationary pressures, higher borrowing costs and a barrage of other headwinds. Consumers continue to spend aggressively on services, businesses are still investing and the labor market remains incredibly strong. Secure jobs are the most important element in consumer spending and well-employed Americans have powered the economic recovery for three years.

However, looming risks to the economy are increasing in number and size. According to a new quarterly report from CoBank’s Knowledge Exchange, the full impact of monetary policy actions—raising interest rates, quantitative easing and contracting the money supply—have yet to be felt. Those policy actions, combined with depleted consumer savings, tighter commercial bank lending standards and the persistently inverted yield curve are likely to result in a mild recession by the fourth quarter of 2023.

The labor market remains relatively tight, but the situation has improved significantly as female and non-native workers have stormed back into the work force. The labor force participation rate for women between the ages of 25-54 now stands at an all-time high, up more than 4 percentage points from the low in April 2020.

Foreign-born employment has increased at roughly double the pace of native-born employment since April 2020. The successes in these two groups have been critical so far in the economic recovery. But looking forward, it raises the question of how many more workers are available to be coaxed in off the sidelines. Ultimately, the U.S. labor force challenges are far from over.

Grains, Farm Supply & Biofuels 

With the corn and soybean growing season in full swing, drought across the Central U.S. is driving heightened seasonal market volatility. Markets are balancing the quickly deteriorating crop conditions against the potential for El Nino to bring wetter conditions later in the growing season. Wheat harvest is advancing northward in the U.S. and is revealing high variability in crop quality. USDA expects the U.S. hard red winter wheat crop to be the smallest since 1957 on substantially higher abandonments and lower yields.

Ag retailers faced a more challenging environment in the second quarter as fertilizer prices continued to fall. Prices were weighed down by reduced demand, as farmers took advantage of pre-payment programs last fall to purchase fertilizer in advance. Despite an overall slowdown in inflation, ag retailers continued to face rising costs, especially for property insurance. Grain and farm supply cooperatives paid about 50% more for property and casualty insurance coverage during the January and April 2023 renewal seasons.

The ethanol complex delivered strong second quarter results with steady production and above-average profitability. Operating margins averaged 45 cents per gallon, nearly double the long-term average. While the finalized blending requirements under the Renewable Fuel Standard (RFS) were somewhat disappointing for ethanol, they were incrementally positive for biomass-based diesel. The new rules call for 2.82 billion gallons of biodiesel and renewable diesel in 2023 and 3.35 billion gallons in 2025.

Animal Protein & Dairy

As the summer grilling season kicked off, beef demand remained incredibly resilient despite elevated prices for consumers. Retail beef prices averaged $7.50 per pound in May, a record high for the period, and an increase of 2% year-over-year. Robust demand combined with tighter cattle supplies spurred market momentum for cattle. Fed cattle values reached record levels, above $180 per cwt. and feeder cattle shot above $240 per cwt. While consumers have yet to balk at higher beef prices, things could quickly change when seasonal support wanes.

Excess hog supply and weak pork demand put hog prices in jeopardy this spring. After a steady start to the year, the CME lean hog index tumbled about $10 per cwt., to $72 from mid-March to late April. However, more favorable market conditions across the animal protein segment drove lean hog values up 30% through May and June. While still down about $15 year-over-year, the pork cutout landed in the upper $90s, gaining about $20 per cwt. through the quarter.

Domestic chicken consumption was up about 4% year-over-year through June 1, which has helped chip away at elevated cold storage holdings. Wholesale broiler meat prices have largely rebounded to pre-pandemic levels, following significant declines in late 2022 and early 2023. Feed costs have come down about 10% from last year but remain well above their historic averages. For broiler integrators, increased feed costs coupled with higher operational expenses have crimped profitability.

U.S. milk producers continue to struggle in the current price environment. The national all-in mailbox milk price has dropped below the $20 per cwt. mark after averaging $25.34 per cwt. in 2022. While several factors are to blame for this year’s milk price decline, the sharp drop in American/cheddar-style cheese prices is the most significant. Prices for the category have dropped by one-third since the beginning of the year. Milk and feed futures suggest producer profitability should improve considerably by October when Class III milk prices are anticipated to increase by about $3 per cwt.

Cotton, Rice & Specialty Crops

U.S. cotton production is rebounding from last year’s crop that was devastated by extreme drought across the southwest. Recent rainfall in top-producing Texas is expected to reduce abandonment following three years of severe drought. The U.S. cotton crop is now estimated at 16.5 million bales, up 14% from last year. Price inflation for clothing and apparel in the U.S. continues to ease with the moderation of cotton prices, which may work to draw in new consumer demand.

U.S. rice production is expected to recover from last year’s small crop, although concerns over dryness and worsening conditions in the mid-South have led to increased volatility of rough rice prices. With improved water availability this year, California medium grain rice production is also expected to rebound with planted acreage at 465,000 acres. That’s a substantial increase from last year’s planted acreage of 220,000 acres that were restricted by historic drought conditions.

Sugar prices remain historically high as markets ration tight global supplies. USDA currently calls for a rebound in world sugar production for 2023-2024, but concerns are growing that El Nino will result in smaller harvests in 2023-2024. In the U.S., there is no relief in sight for high prices as wet weather delayed planting across northern states this spring, which resulted in a smaller U.S. sugarbeet crop.

The tight farm labor market continues to be especially challenging for U.S. specialty crop producers. The Federal Reserve Bank of San Francisco reported that weekly median wages for farm workers swelled to a record high $915 in April, a 24% increase from the year earlier. In June, the House Agriculture Committee created a bipartisan working group, tasked with evaluating the H-2A program and finding solutions for the labor supply challenges facing farmers.

Food & Beverage

While food manufacturers generally indicate they are back to business as usual in the post-pandemic era, many consumers continue to harbor a crisis-management mentality when it comes to food costs. Rising food prices are challenging both at-home and away-from-home food spending. The Consumer Price Index for all food in May was 6.7% higher than May 2022, while food away-from-home prices were up 8.3%. To offset higher prices, consumers are continuing behaviors initially seen during the pandemic, namely eating more meals at home. Foot traffic in restaurants remains well below pre-pandemic levels.

Power, Water & Communications

Falling fuel and energy prices have brought some much-needed relief to rural consumers, who were uniquely disadvantaged by rising energy bills in recent years. Gasoline, diesel, heating oil, natural gas and electricity all cost less than they did a year ago. Rural discretionary incomes fell by a staggering 50% from 2020 to 2022 compared to 13% for urban residents. Transportation and home energy expenses were responsible for two-thirds of the inflationary divide between rural and urban households.

Microsoft, Google and Meta are investing billions of dollars in artificial intelligence applications, which have exploded onto the scene in recent months. Applications like ChatGPT will dramatically increase the need for data processing capacity, fiber network connectivity and other communications infrastructure. Telecommunications operators in rural and smaller cities are well positioned to meet this growing need, as data storage and computation needs to occur in near proximity to where AI applications are run.

Read The Quarterly. Each CoBank Quarterly provides updates and an outlook for the Macro Economy and U.S. Agricultural Markets; Grains, Biofuels and Farm Supply; Animal Protein; Dairy; Cotton and Rice; Specialty Crops; Food & Beverage industries and Rural Infrastructure.

motorcycle

U.S. Motorcycle and Scooter Import Plummets 11%, Averaging $236M in May 2023

U.S. Motorcycle And Scooter Imports

In May 2023, supplies from abroad of motorcycles and scooters decreased by -7.6% to 49K units for the first time since February 2023, thus ending a two-month rising trend. Over the period under review, imports recorded a slight reduction. The most prominent rate of growth was recorded in October 2022 when imports increased by 49% m-o-m. As a result, imports attained the peak of 75K units. From November 2022 to May 2023, the growth of imports failed to regain momentum.

In value terms, motorcycle and scooter imports fell to $236M (IndexBox estimates) in May 2023. Overall, imports saw a perceptible curtailment. The most prominent rate of growth was recorded in October 2022 with an increase of 50% month-to-month. As a result, imports attained the peak of $332M. From November 2022 to May 2023, the growth of imports remained at a lower figure.

Imports by Country

China (11K units), Austria (9.8K units) and Thailand (6.1K units) were the main suppliers of motorcycle and scooter imports to the United States, together comprising 55% of total imports. These countries were followed by Japan, India, Italy, Indonesia, Canada and Mexico, which together accounted for a further 37%.

From May 2022 to May 2023, the biggest increases were in India (with a CAGR of +4.6%), while purchases for the other leaders experienced mixed trend patterns.

In value terms, Austria ($48M), Canada ($38M) and Japan ($32M) were the largest motorcycle and scooter suppliers to the United States, together comprising 50% of total imports. These countries were followed by Thailand, Italy, India, Mexico, China and Indonesia, which together accounted for a further 35%.

Among the main suppliers, India, with a CAGR of +5.3%, recorded the highest growth rate of the value of imports, over the period under review, while purchases for the other leaders experienced mixed trend patterns.

Imports by Type

Motorcycles (including mopeds) and cycles; fitted with an auxiliary motor, reciprocating internal combustion piston engine, of cylinder capacity exceeding 50cc but not exceeding 250cc, with or without side-cars; side-cars (23K units), motorcycles (including mopeds) and cycles; fitted with an auxiliary motor, reciprocating internal combustion piston engine, of cylinder capacity exceeding 250cc but not exceeding 500cc, with or without side-cars; side-cars (13K units) and motorcycles (including mopeds) and cycles; fitted with auxiliary motor, with reciprocating internal combustion piston engine of a cylinder capacity exceeding 800cc, with or without side-cars; side-cars (9K units) were the main products of motorcycle and scooter imports to the United States, with a combined 93% share of total imports.

From May 2022 to May 2023, the biggest increases were in motorcycles (including mopeds) and cycles; fitted with an auxiliary motor, reciprocating internal combustion piston engine, of cylinder capacity exceeding 250cc but not exceeding 500cc, with or without side-cars; side-cars (with a CAGR of +0.1%), while purchases for the other products experienced a decline.

In value terms, motorcycles (including mopeds) and cycles; fitted with auxiliary motor, with reciprocating internal combustion piston engine of a cylinder capacity exceeding 800cc, with or without side-cars; side-cars ($117M) constituted the largest type of motorcycle and scooter supplied to the United States, comprising 50% of total imports. The second position in the ranking was taken by motorcycles (including mopeds) and cycles; fitted with an auxiliary motor, reciprocating internal combustion piston engine, of cylinder capacity exceeding 250cc but not exceeding 500cc, with or without side-cars; side-cars ($53M), with a 23% share of total imports. It was followed by motorcycles (including mopeds) and cycles; fitted with an auxiliary motor, reciprocating internal combustion piston engine, of cylinder capacity exceeding 50cc but not exceeding 250cc, with or without side-cars; side-cars, with a 17% share.

Import Prices by Country

In May 2023, the motorcycle and scooter price stood at $4,783 per unit (CIF, US), falling by -3.8% against the previous month. Over the period under review, the import price recorded a relatively flat trend pattern. The most prominent rate of growth was recorded in February 2023 when the average import price increased by 12% month-to-month. As a result, import price attained the peak level of $5.3M per thousand units. From March 2023 to May 2023, the average import prices failed to regain momentum.

Prices varied noticeably by the country of origin: the country with the highest price was Canada ($20,797 per unit), while the price for China ($831 per unit) was amongst the lowest.

From May 2022 to May 2023, the most notable rate of growth in terms of prices was attained by Italy (+2.2%), while the prices for the other major suppliers experienced more modest paces of growth.

Source: IndexBox Market Intelligence Platform 

varnishes

How to Succeed in Introducing Paints and Varnishes into the US Market

Entering the paints and varnishes market in the United States can be a lucrative opportunity for businesses. The U.S. is one of the largest consumers and importers of paints and varnishes globally, making it an attractive market for international players. However, navigating the market can be complex, and a well-defined market entry strategy is crucial for success.

Market Overview

The United States has a robust paints and varnishes market, driven by various factors such as increasing construction activities, infrastructure development, and the growth of the automotive industry. According to the data from the IndexBox platform, the United States recorded a consumption volume of 4.532 million tons in 2022, making it the largest consumer of paints and varnishes globally.

The U.S. paints and varnishes market is also a significant importer, with an import value of USD 1.243 billion in 2022. This indicates the potential for international companies to enter the market and supply their products to meet the growing demand.

Market Entry Strategy

1. Market Research and Analysis:

Conduct thorough market research to understand the current dynamics, trends, and consumer preferences in the U.S. paints and varnishes market. Utilize market intelligence platforms like IndexBox to gather official data and insights.

2. Regulatory Compliance:

Familiarize yourself with the regulatory requirements and standards for paints and varnishes in the United States. Ensure that your products meet all the necessary quality and safety standards set by the authorities.

3. Distribution Channels:

Identify the most effective distribution channels to reach your target customers. This could include partnering with local distributors, wholesalers, or establishing your own distribution network.

4. Pricing Strategy:

Develop a competitive pricing strategy based on the market dynamics and competition. Consider factors such as import prices, domestic pricing, and the value proposition of your products.

5. Marketing and Promotion:

Create a comprehensive marketing and promotion plan to raise awareness about your brand and products. Leverage digital marketing channels, trade publications, and participate in industry-specific trade shows and exhibitions.

Official Data Sources and Authorities

When entering the U.S. market for paints and varnishes, it is essential to rely on official data sources and seek assistance from relevant authorities. Here are some key sources and authorities:

U.S. Census Bureau: The U.S. Census Bureau provides valuable data on imports, exports, and trade statistics. It can help you understand the market size, trends, and competitive landscape.

Environmental Protection Agency (EPA): The EPA regulates the environmental impact of paints and varnishes. Familiarize yourself with their guidelines and compliance requirements.

Occupational Safety and Health Administration (OSHA): OSHA sets safety standards for workers in the paints and varnishes industry. Ensure that your operations and products comply with their regulations.

National Paint and Coatings Association (NPCA): NPCA is a trade association representing the paints and coatings industry. They can provide valuable insights, networking opportunities, and industry-specific resources.

Trade Shows and Exhibitions

Participating in trade shows and exhibitions is an excellent way to showcase your products, network with industry professionals, and gain exposure in the U.S. market. Here is a list of some prominent trade shows and exhibitions related to paints and varnishes:

National Hardware Show: This annual event showcases a wide range of hardware and home improvement products, including paints and varnishes.

GlobalShop: GlobalShop is a leading trade show for retail design, merchandising, and shopper marketing. It attracts professionals from various industries, including paints and coatings.

CoatingsTech Conference: This conference focuses on the latest innovations, technologies, and trends in the coatings industry. It provides a platform for knowledge sharing and networking.

Architectural Digest Design Show: This premier design show features a curated selection of products from leading brands, including paints and coatings for architectural purposes.

Make sure to research and select the most relevant trade shows and exhibitions based on your target market and product offerings.

Conclusion

Entering the paints and varnishes market in the United States requires a well-planned market entry strategy. By conducting thorough market research, complying with regulations, identifying effective distribution channels, and implementing a comprehensive marketing plan, businesses can position themselves for success. Utilize official data sources and seek assistance from relevant authorities to ensure compliance and stay updated with market trends. Participating in trade shows and exhibitions can also provide valuable exposure and networking opportunities. With the right strategy and approach, businesses can tap into the immense potential of the U.S. paints and varnishes market.

Source: IndexBox Market Intelligence Platform

iron

 Smoothing Iron Import in United States Soars 30%, Averaging $12M in April 2023

U.S. Smoothing Iron Imports

In April 2023, approximately 1.3M units of electric smoothing irons were imported into the United States; picking up by 18% against March 2023 figures. In general, total imports indicated mild growth from April 2022 to April 2023: its volume increased at an average monthly rate of +1.2% over the last twelve-month period. The trend pattern, however, indicated some noticeable fluctuations being recorded throughout the analyzed period. Based on April 2023 figures, imports increased by +58.1% against February 2023 indices. The most prominent rate of growth was recorded in May 2022 with an increase of 68% against the previous month. As a result, imports reached the peak of 1.9M units. From June 2022 to April 2023, the growth of imports remained at a lower figure.

In value terms, smoothing iron imports skyrocketed to $12M (IndexBox estimates) in April 2023. Overall, total imports indicated slight growth from April 2022 to April 2023: its value increased at an average monthly rate of +1.2% over the last twelve-month period. The trend pattern, however, indicated some noticeable fluctuations being recorded throughout the analyzed period. Based on April 2023 figures, imports increased by +39.7% against February 2023 indices. The most prominent rate of growth was recorded in May 2022 when imports increased by 81% m-o-m.

Over the period under review, imports attained the peak figure at 19M units in June 2022; however, from July 2022 to April 2023, imports stood at a somewhat lower figure.

Imports by Country

In April 2023, China (1.3M units) was the main smoothing iron supplier to the United States, with a approximately 97% share of total imports.

From April 2022 to April 2023, the average monthly rate of growth in terms of volume from China totaled +1.2%.

In value terms, China ($11M) constituted the largest supplier of smoothing iron to the United States.

From April 2022 to April 2023, the average monthly growth rate of value from China was relatively modest.

Import Prices by Country

In April 2023, the smoothing iron price stood at $9.1 per unit (CIF, US), with an increase of 9.8% against the previous month. Overall, the import price saw a relatively flat trend pattern. The growth pace was the most rapid in June 2022 an increase of 11% against the previous month. Over the period under review, average import prices hit record highs at $11.2 per unit in December 2022; however, from January 2023 to April 2023, import prices stood at a somewhat lower figure.

As there is only one major supplying country, the average price level is determined by prices for China.

From April 2022 to April 2023, the rate of growth in terms of prices for China amounted to -0.2% per month.

Source: IndexBox Market Intelligence Platform