New Articles

Cities With the Largest Increase in New Business Applications Since COVID

business applications

Cities With the Largest Increase in New Business Applications Since COVID

The COVID-19 pandemic has been particularly hard on small businesses, which are estimated to employ nearly half of all American workers. A recent Federal Reserve Bank study noted that the pandemic caused an additional 200,000 businesses to close their doors last year, with small businesses comprising the bulk of the difference.

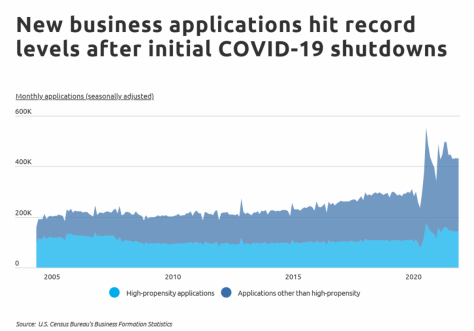
However, it hasn’t been all bad news for the nation’s small businesses. A real-time survey of business applications conducted by the U.S. Census Bureau offers encouraging results: the increase in business shutdowns combined with changes in consumer preferences created gaps for new entrants to fill, resulting in a strong resurgence of new businesses. Between 2019 and 2020, there was a nearly 25% increase in new business applications, and that increase has held relatively steady through 2021. About one-third of current applications are considered “high-propensity applications,” or those with a high likelihood of turning into a business with payroll.


At the industry level, the increase in new business applications is being led by the retail trade sector of the economy. When comparing the number of applications from 2019 to 2020, retail trade applications increased by 59%, followed by the transportation sector which increased nearly 35%. Further, the largest percentage increases in applications were more likely to occur in those sectors already generating the highest number of applications overall. Together, this indicates the start of a robust trend for total small business creation in the economy.

While total business applications grew markedly since the beginning of the pandemic, the strongest increases appeared in the Southeast. Mississippi, Georgia and Louisiana lead the nation with application increases of over 55%. Yet, not all states fared well, as Alaska and North Dakota each saw small, single-digit percentage decreases over the same time period. At the metro level, those reporting the largest increases in new business applications are also found in the Southeast, with a handful of locations in Texas and the Midwest also ranking highly.

The data used in this analysis is from the U.S. Census Bureau. To determine the locations with the largest increase in new business applications since COVID-19, researchers at Self Financial calculated the percentage change in new business applications from 2019 to 2020. In the event of a tie, the location with the higher total change in business applications from 2019 to 2020 was ranked higher.

Here are the large U.S. metropolitan areas with the largest increase in new business applications since the start of the pandemic.


Metro Rank Percentage change in business applications (2019-2020) Total change in business applications (2019-2020) Total business applications in 2020 Total business applications in 2019
Memphis, TN-MS-AR    1    +77.7% +11,554 26,431 14,877
Atlanta-Sandy Springs-Alpharetta, GA    2    +56.8% +73,365 202,603 129,238
New Orleans-Metairie, LA    3    +55.6% +10,659 29,830 19,171
Cleveland-Elyria, OH    4    +54.5% +11,302 32,045 20,743
Chicago-Naperville-Elgin, IL-IN-WI    5    +49.7% +51,394 154,758 103,364
Detroit-Warren-Dearborn, MI    6    +48.9% +26,947 82,098 55,151
Milwaukee-Waukesha, WI    7    +37.6% +5,773 21,127 15,354
Houston-The Woodlands-Sugar Land, TX    8    +37.4% +32,185 118,183 85,998
Charlotte-Concord-Gastonia, NC-SC    9    +35.3% +11,879 45,487 33,608
Birmingham-Hoover, AL    10    +35.3% +4,070 15,593 11,523
Virginia Beach-Norfolk-Newport News, VA-NC    11    +35.0% +6,683 25,783 19,100
Philadelphia-Camden-Wilmington, PA-NJ-DE-MD    12     +33.4% +25,103 100,265 75,162
Riverside-San Bernardino-Ontario, CA    13    +32.2% +10,944 44,887 33,943
Fresno, CA    14    +32.1% +1,782 7,332 5,550
Jacksonville, FL    15    +31.8% +7,537 31,202 23,665
United States    –    +24.2% +848,210 4,356,870 3,508,660


For more information, a detailed methodology, and complete results, you can find the original report on Self Financial’s website: https://www.self.inc/blog/us-cities-increase-in-new-business-applications

college

Best-Paying Cities for Recent College Grads

As college education costs climb higher, landing a well-paying job after graduation is even more important than ever before. Over half of young adults who attended college incurred some debt, with typical levels of student loans in the range of $20,000 to $25,000 post-graduation. According to the latest data from the Bureau of Labor Statistics (BLS), median earnings for recent college graduates working full-time is approximately $50,000 per year. However, the number varies widely by city, college major, and occupation, among other factors.

The good news is that while the median wage for recent graduates (adjusted for inflation) has fluctuated over the last several decades, the number hit a new peak last year, climbing by nearly $4,500 from 2019 to 2020. What’s concerning is that the $50,000 annual wage figure for 2020 is from survey data collected in March of last year, so it does not adequately reflect the impact of the COVID-19 pandemic. College graduates seeking employment last spring faced the worst job market since the Great Depression, and it remains to be seen how wages will be affected in the coming years.

Attaining a bachelor’s degree boosts earning potential by a large margin—median annual earnings of recent college graduates is about $20,000 more than workers of the same age with only a high school diploma. However, some fields of study pay off much more than others. The highest-paying majors for recent college graduates are computer science and several types of engineering degrees, such as chemical, computer, and electrical. Median earnings for recent graduates within these majors is $70,000 per year, or about 40 percent higher than the typical graduate.

While academic major is one of the strongest predictors of earnings post-graduation, so too is location. Additionally, large differences in cost of living across locations affect how comfortable it is to live on a given wage and how easy it is to pay off loans. At the state level, recent graduates working full-time in North Dakota and Montana have the highest median earnings after adjusting for cost of living, at $53,751 and $51,337, respectively. Despite being one of the lowest-cost states to live in, New Mexico also reports the lowest cost-of-living adjusted median wage for full-time recent graduates, at just $36,224 per year.

To find the best-paying metropolitan areas for recent college graduates, researchers at Self analyzed the latest earnings data from the U.S. Census Bureau and cost of living data from the U.S. Bureau of Economic Analysis. The researchers ranked metro areas according to the cost-of-living adjusted median earnings for full-time working college graduates aged 22 to 27 with a bachelor’s degree only. Researchers also calculated the unadjusted median earnings for recent graduates and the recent college graduate proportion of the population. Only the 50 largest metropolitan areas were included in the analysis.

Here are the best-paying U.S. metros for recent college graduates.

Metro Rank   Median earnings for recent college grads (adjusted)    Median earnings for recent college grads (actual)    Recent college grad proportion of the total population    Cost of living


San Jose-Sunnyvale-Santa Clara, CA     1      $56,827 $72,000 3.3% 26.7% above average
St. Louis, MO-IL     2      $53,274 $48,000 2.1% 9.9% below average
Kansas City, MO-KS     3      $52,802 $49,000 2.3% 7.2% below average
Pittsburgh, PA     4      $52,706 $48,700 2.8% 7.6% below average
Detroit-Warren-Dearborn, MI     5      $52,466 $50,000 2.1% 4.7% below average
Cleveland-Elyria, OH     6      $52,280 $47,000 2.1% 10.1% below average
San Francisco-Oakland-Hayward, CA     7      $52,045 $70,000 3.4% 34.5% above average
Columbus, OH     8      $51,856 $47,500 2.7% 8.4% below average
Dallas-Fort Worth-Arlington, TX     9      $49,407 $50,000 2.3% 1.2% above average
Austin-Round Rock, TX     10      $49,345 $49,000 3.2% 0.7% below average
Houston-The Woodlands-Sugar Land, TX     11      $49,164 $50,000 1.9% 1.7% above average
Providence-Warwick, RI-MA     12      $48,853 $49,000 2.5% 0.3% above average
Chicago-Naperville-Elgin, IL-IN-WI     13      $48,638 $50,000 2.8% 2.8% above average
Minneapolis-St. Paul-Bloomington, MN-WI     14      $48,591 $50,000 3.0% 2.9% above average
Cincinnati, OH-KY-IN     15      $48,565 $44,000 2.4% 9.4% below average
United States     –      N/A $45,000 2.1% Average


For more information, a detailed methodology, and complete results, you can find the original report on Self Financial’s website: https://www.self.inc/blog/best-paying-cities-for-recent-college-grads