New Articles

States With the Biggest Drop in Consumer Spending During COVID-19

consumer spending

States With the Biggest Drop in Consumer Spending During COVID-19

The latest surge in COVID-19 cases caused by the Omicron variant once again disrupted an economic recovery that has been uneven to date. While most jurisdictions did not resort to the same sorts of public health restrictions instituted in early 2020, many businesses struggled to operate at full capacity with employees sick due to COVID and many consumers behaving more cautiously. Industries that have been hard-hit throughout the pandemic, like restaurants and airlines, experienced new disruptions heading into 2022.

Economic challenges associated with Omicron and future variants could once again depress consumer spending, piling on top of an unusual decrease in consumer expenditures during the pandemic’s first year. For most of the last 60 years, consumer spending has increased year over year, even during economic downturns. But from 2019 to 2020, overall consumer spending fell by 2.6%, the largest year-over-year decline since the Great Recession.

COVID’s effects on consumer spending have not been consistent across all categories, which means that some industries are struggling more than others. Public health restrictions affecting certain types of businesses and consumers’ shifting preferences from spending more time at home have driven trends in expenditures. In some cases, these factors have created divergent spending trends between similar categories. For example, spending on food services and accommodations dropped by 20.5% from 2019 to 2020, while spending on groceries was up 11.2% over the same period. Similarly, recreation services—which includes businesses like sports venues and theaters—saw the largest overall decline at 28.6%, but recreational goods and vehicles saw the largest overall increase at 13.1%.

In addition to differences by spending category, declines in consumer spending also varied by geography. The region with the greatest drop in spending was the Mideast (including Delaware, New Jersey, New York, Pennsylvania, and Maryland), with a 4.07% decrease from 2019 to 2020, followed by the Far West at 4.03%. In contrast, the Rocky Mountain region had the lowest decrease, with consumers spending only 1.25% less in 2020 than in 2019.

Among states, most of the locations where consumer spending dropped the most were found in the Mideast, Far West, and New England regions. For most of these states, the declines are explained in large part by decreases in spending on recreation services, transportation services, or both. Recreation services were slow to return to full capacity in many locations because they were considered less essential and frequently likely to contribute to the spread of the coronavirus. Areas with high populations of commuters usually relying on vehicles or public transportation, like densely populated areas in the Northeast, saw declines in transportation spending with the greater transition to remote work.

The data used in this analysis is from the U.S. Bureau of Economic Analysis’s Personal Consumption Expenditures. To determine the states with the biggest drop in spending during COVID-19, researchers at Filterbuy calculated the percentage change in per capita consumer spending from 2019 to 2020. In the event of a tie, the state with the lower total change in per capita consumer spending from 2019 to 2020 was ranked higher.

Here are the states with the biggest drop in spending during COVID.

State Rank Percentage change in consumer spending (2019-2020) Total change in consumer spending (2019-2020) Per capita consumer spending (2020) Per capita consumer spending (2019) Category with the largest decrease in spending
Alaska    1    -5.4% -$2,760 $48,739 $51,499 Recreation services
Massachusetts    2    -5.0% -$2,762 $52,001 $54,763 Transportation services
Hawaii    3    -4.7% -$2,233 $45,080 $47,313 Transportation services
New York    4    -4.6% -$2,416 $49,735 $52,151 Transportation services
Minnesota    5    -4.6% -$2,129 $44,403 $46,532 Recreation services
Maryland    6    -4.4% -$2,051 $44,331 $46,382 Recreation services
California    7    -4.3% -$2,086 $46,636 $48,722 Recreation services
Pennsylvania    8    -3.9% -$1,828 $44,650 $46,478 Recreation services
Vermont    9    -3.8% -$1,888 $47,397 $49,285 Recreation services
Nevada    10    -3.8% -$1,532 $39,211 $40,743 Gasoline and other energy goods
North Dakota    11    -3.7% -$1,668 $43,945 $45,613 Gasoline and other energy goods
Rhode Island    12    -3.7% -$1,660 $42,944 $44,604 Gasoline and other energy goods
Washington    13    -3.5% -$1,647 $46,041 $47,688 Transportation services
Delaware    14    -3.2% -$1,526 $45,434 $46,960 Transportation services
Florida    15    -3.1% -$1,376 $43,615 $44,991 Transportation services
United States    -3.0% -$1,311 $42,635 $43,946 Recreation services


For more information, a detailed methodology, and complete results, you can find the original report on Filterbuy’s website: https://filterbuy.com/resources/consumer-spending-covid/

occupation

Cities With the Most Contact-Intensive Occupations

Social distancing measures used to help fight COVID-19 hit certain businesses and occupations especially hard. “Nonessential” occupations that require a high degree of face-to-face interaction—such as cosmetologists, bartenders, and athletic trainers—have been the most vulnerable throughout the pandemic, with large swaths of workers in these fields facing reduced hours or unemployment.

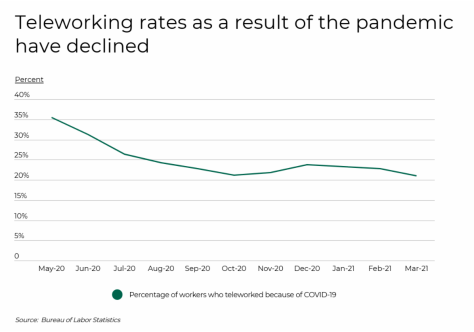
On the other hand, essential workers in occupations with high levels of physical contact—for example, healthcare and logistics workers—have not experienced the same job losses, but have had to grapple with the increased risk of exposure to the virus. According to data from the Bureau of Labor Statistics (BLS) and the Occupation Information Network (O*NET), more than half of U.S. jobs require very close (near touching) or moderately close (at arm’s length) contact with others while at work. And while much of the economy has gone virtual, new data from the BLS shows that only about 20% of workers are currently teleworking because of the pandemic.

Despite an increasing number of industries transitioning online, jobs that depend on close proximity to others are generally not suitable for teleworking. Over 86% of healthcare practitioners and health care support workers are required to be in close contact with others. While telehealth services have increased dramatically during the pandemic, most healthcare workers have no other option but to work in an in-person setting. Other occupational groups requiring similar levels of close contact include food preparation and serving, personal care, and protective service. At the opposite end of the spectrum, less than a quarter of workers in legal, computer, math, business, finance, architecture, and engineering occupations work in close contact.

The share of workers in contact-intensive occupations varies geographically due to local industry makeup. To find the areas with the most contact-intensive occupations, researchers at Filterbuy analyzed the latest data from the BLS and O*NET to create a composite index based on the share of employment in different occupations and O*NET’s occupation-specific physical proximity scores. Researchers also calculated the percentage of workers in very close or moderately close contact with others, the percentage of workers in healthcare occupations, the percentage of workers in food preparation and serving jobs, and the median annual wage.

At the state level, Mississippi and South Carolina rank highest according to the composite index. About 60% of workers in Mississippi and 58% in South Carolina work in very close or moderately close contact with others. In general, states with higher concentrations of healthcare workers or higher concentrations of food preparation and serving jobs score highly on the index.

At the local level, similar patterns also hold true. To find the metropolitan areas with the most contact-intensive occupations, Filterbuy used the same methodology, but only included locations with at least 100,000 people. Additionally, metro areas were grouped into the following cohorts based on population size:

-Small metros: 100,000–349,999

-Midsize metros: 350,000–999,999

-Large metros: 1,000,000 or more

Here are the large metros with the most contact-intensive occupations.

Metro Rank Composite index Percentage of workers in very close contact with others Percentage of workers in moderately close contact with others Percentage of workers in healthcare occupations Percentage of workers in food preparation and serving related Median annual wage


Miami-Fort Lauderdale-West Palm Beach, FL     1     97.1 21.4% 35.2% 9.6% 8.7% $38,690
Pittsburgh, PA     2     97.1 23.2% 33.2% 13.6% 7.7% $43,200
Las Vegas-Henderson-Paradise, NV     3     96.9 23.3% 37.9% 8.7% 12.7% $37,690
Philadelphia-Camden-Wilmington, PA-NJ-DE-MD     4     94.8 22.7% 32.6% 13.5% 6.9% $46,500
San Antonio-New Braunfels, TX     5     94.7 23.3% 35.0% 11.6% 10.0% $37,920
Riverside-San Bernardino- Ontario, CA     6     94.4 23.1% 36.6% 11.2% 9.0% $39,630
Providence-Warwick, RI-MA     7     94.0 22.8% 34.5% 12.2% 8.6% $46,000
Cleveland-Elyria, OH     8     93.8 21.9% 33.8% 11.9% 7.4% $42,740
Oklahoma City, OK     9     93.7 21.8% 34.9% 10.4% 10.0% $39,080
St. Louis, MO-IL     10     93.4 22.2% 33.3% 12.0% 8.4% $42,060
Milwaukee-Waukesha-West Allis, WI     11     93.1 22.6% 33.1% 13.4% 6.6% $43,380
Detroit-Warren-Dearborn, MI     12     93.1 20.9% 33.5% 10.8% 7.1% $44,840
New York-Newark-Jersey City, NY-NJ-PA     13     92.3 22.5% 32.1% 12.8% 6.2% $52,020
Cincinnati, OH-KY-IN     14     92.3 20.8% 34.2% 10.0% 8.4% $41,660
Birmingham-Hoover, AL     15     91.7 22.0% 35.1% 11.6% 8.3% $39,530
United States     –     64.0 21.6% 34.3% 10.8% 8.1% $41,950


For more information, a detailed methodology, and complete results, you can find the original report on Filterbuy’s website: https://filterbuy.com/resources/cities-with-move-contact-intensive-occupations/

businesses

U.S. States That Have Started Opening Up for Business

After more than a year of living through the pandemic, most of the signs lately suggest that the U.S. has turned the corner in the fight against COVID-19.

Average daily case numbers nationwide have fallen by around 80% from their peak in the U.S., from more than 250,000 per day in early January to just under 50,000 per day in early May. After a bumpy initial rollout, vaccines are now available to all adults nationwide, and the U.S. averaged more than 2 million doses administered per day during March and April. While COVID-19 still presents risks—more contagious variants continue to spread in some parts of the U.S. and vaccine hesitancy has begun to slow down the number of doses administered—a return to normalcy for many Americans now seems closer than it has at any point since the pandemic began.

More states and local governments are responding to these encouraging developments by loosening or entirely lifting restrictions that have been kept in place to minimize the spread of COVID-19 during the pandemic. Meanwhile, individuals are increasingly resuming their normal lives, comforted by the protection of the vaccines and the diminished spread of the virus.

This is all good news for the economy. Survey results from the Bureau of Labor Statistics show that more than half of U.S. businesses experienced reduced consumer demand as a result of the pandemic, leading to job losses and lost income. But as the COVID situation improves and restrictions are rolled back, policymakers and business owners are optimistic that economic activity will return to pre-pandemic levels this summer.

According to community mobility data that Google has collected during the pandemic, visits to retail and recreation establishments, transit stations, and workplaces (strong indicators of overall business activity) are still below their baseline levels from early 2020 but are moving in the right direction. Retail and recreation establishments are showing particularly positive trends, nearly returning to their baseline levels this spring with the drop in COVID cases and increase in vaccinations. Visits to transit stations and workplaces are down by around a quarter on average, a product of many workers continuing to work from home and forgoing business travel, but both categories have seen incremental increases since the start of 2021.

In addition to differences by type of establishment, reopening trends also vary significantly from state to state according to the Google data. One of the major reasons why states have reopened at different rates is that public attitudes toward COVID-19 became highly politicized throughout the contentious 2020 election cycle and beyond. This has affected both individuals’ behaviors and governments’ approach to public health restrictions: in general, more politically conservative areas have moved more quickly toward reopening and their politically liberal counterparts have shown more caution. Many of these more conservative states are also more rural and less densely populated, factors that also lower some of the perceived risks associated with COVID-19.

To identify the states that have reopened most quickly, Filterbuy researchers used data from Google’s COVID-19 Community Mobility Reports to create a composite index based on April 2021 visits to retail and recreation, transit, and workplace establishments. Filterbuy’s research team calculated the percentage change in visits to such establishments compared to a pre-pandemic baseline period of January 3 to February 6, 2020.

Here are the states that have started opening up for business.

State Rank Composite index Retail & recreation change from baseline Transit stations change from baseline Workplaces change from baseline


Montana    1     97.93 6.1% 14.6% -14.6%
South Dakota    2     97.23 5.6% 15.4% -13.6%
Idaho    3     92.47 6.0% 14.2% -16.9%
Arkansas    4     91.10 5.8% 13.2% -16.9%
Mississippi    5     87.03 5.3% 21.9% -19.0%
Iowa    6     85.00 5.4% -3.9% -15.8%
Oklahoma    7     83.63 2.5% 11.1% -17.3%
South Carolina    8     81.60 5.1% 13.8% -20.6%
Nebraska    9     78.17 1.9% 4.7% -18.1%
Alaska    10     77.50 2.8% -8.5% -16.7%
West Virginia    11     77.50 1.7% 6.1% -18.1%
Kansas    12     77.50 -1.0% 9.7% -17.7%
Missouri    13     76.83 3.1% 0.9% -18.8%
Alabama    14     76.83 1.2% 7.6% -18.2%
Wyoming    15     75.47 -4.6% 12.6% -16.7%
United States    –     N/A -8.3% -24.9% -25.7%


For more information, a detailed methodology, and complete results, you can find the original report on Filterbuy’s website: https://filterbuy.com/resources/states-that-have-started-reopening/

work from home

Cities Most Prepared to Work From Home

Since March of 2020, the COVID-19 pandemic has caused record numbers of Americans to transition to remote work. As COVID cases have surged across the country, recent CDC guidelines suggest that workers should be allowed to work remotely if they can. While many jobs are suitable for a remote work environment, most are not. Using data from the Census Bureau as well as a recent study by University of Chicago researchers, about 31 percent of U.S. workers are employed in remote-friendly jobs, but this varies substantially on a geographic level. Additionally, not everyone who works in an occupation that can be performed remotely is well-positioned to do so. Differences in computer and high-speed internet access, as well as available space in the household, all impact an individual’s preparedness for remote work.

Working from home typically requires both a computer and a high-speed internet connection. According to data from the Census Bureau, nearly a quarter of U.S. households don’t own a computer and close to 30 percent lack broadband internet, such as cable, fiber optic, or DSL. Not surprisingly, owning a computer and having high-speed internet tend to go hand in hand. At the state level, states, where more households own computers, are also home to more households with high-speed internet. On a regional level, the South is less prepared to work from home—Southern states tend to have lower rates of home computer ownership and fewer households with broadband internet.

In addition to having the necessary hardware and internet access, being able to create a clear boundary between your home life and work-life can make all the difference when working from home. Having a suitable home workspace is associated with increased telework satisfaction and self-reported productivity. Workers with a spare bedroom at home will find it easier to create a dedicated workspace than those whose only option is a shared living area, such as the kitchen or dining room table. For example, while the San Francisco metropolitan area is home to a disproportionate number of laptop workers with high-speed internet access, a majority of these workers don’t have extra space for a home office, making full-time remote work more challenging in the Bay Area than in areas with more affordable housing.

To find the most prepared places in the U.S. to work from home, researchers at Filterbuy analyzed data from the U.S. Census Bureau and the University of Chicago. They created a composite telework preparedness score based on the following factors:

-Percentage of workers in remote-friendly jobs

-Percentage of households with a laptop or desktop computer

-Percentage of households with broadband internet, such as cable, fiber optic or DSL

-Percentage of households with at least one spare bedroom that could be used as a home office

-Median number of rooms per person in each household

At the state level, many of the most-prepared states to work from home are on the East Coast. The two states flanking Washington, D.C., Maryland and Virginia, rank the highest in the country according to the composite score. Over one-third of jobs in each of these states can be performed from home, and a large proportion of households in both states have computers and high-speed internet access. The South tends to be less prepared to work from home. Arkansas ranks the lowest in the country according to its composite score. Just 26 percent of jobs in Arkansas can be performed from home, while less than two-thirds of Arkansas households own computers. Only 56 percent of Arkansas households have high-speed internet.

To find the metropolitan areas in the U.S. most prepared to work from home, researchers at Filterbuy ranked metro areas according to their composite score. To improve relevance, only metropolitan areas with at least 100,000 people were included in the analysis. Additionally, metro areas were grouped into the following cohorts based on population size:

-Small metros: 100,000–349,999

-Midsize metros: 350,000–999,999

-Large metros: 1,000,000 or more

Here are the large metros most prepared to work from home.


Metro Rank   Composite score  Percentage of workers in remote-friendly jobs  Percentage of households with a laptop or desktop computer  Percentage of households with broadband internet  Percentage of households with at least one spare bedroom  Median household rooms per person 


Raleigh-Cary, NC     1 87.69 35.9% 84.6% 78.6% 66.0% 2.7
Atlanta-Sandy Springs-Alpharetta, GA     2 86.99 35.0% 82.8% 76.8% 65.6% 3.0
Washington-Arlington-Alexandria, DC-VA-MD-WV     3 85.72 38.1% 87.6% 82.7% 58.8% 2.7
Minneapolis-St. Paul-Bloomington, MN-WI     4 85.67 35.1% 83.8% 77.1% 63.3% 3.0
Denver-Aurora-Lakewood, CO     5 85.40 35.8% 86.1% 80.6% 61.5% 2.7
Baltimore-Columbia-Towson, MD     6 84.48 35.9% 81.4% 75.6% 63.3% 3.0
Richmond, VA     7 83.74 33.4% 78.1% 70.4% 70.9% 3.0
Charlotte-Concord-Gastonia, NC-SC     8 83.36 32.9% 79.0% 76.1% 66.7% 2.7
Philadelphia-Camden-Wilmington, PA-NJ-DE-MD     9 83.32 33.9% 80.0% 77.6% 61.8% 3.0
Columbus, OH     10 82.01 32.9% 80.4% 77.3% 62.2% 2.7
Tampa-St. Petersburg-Clearwater, FL    11 81.97 31.8% 81.3% 75.9% 64.4% 2.6
Salt Lake City, UT    12 81.70 34.7% 86.6% 76.6% 61.8% 2.5
Seattle-Tacoma-Bellevue, WA    13 81.58 36.6% 87.1% 82.3% 57.0% 2.3
Pittsburgh, PA    14 81.55 32.6% 75.8% 73.5% 67.2% 3.0
Kansas City, MO-KS     5 81.35 32.2% 79.7% 73.5% 64.0% 3.0
United States    – N/A 30.7% 77.3% 70.8% 60.8% 2.5


For more information, a detailed methodology, and complete results, you can find the original report on Filterbuy’s website: https://filterbuy.com/resources/cities-most-prepared-to-work-from-home/

renewable energy

States With the Largest Increase in Renewable Energy Production

One of the most significant trends over the last decade for the economy, society, geopolitics, and the environment has been the rise of renewable energy. Fossil fuels have been the basis of the industrial economy for generations, powering tremendous economic growth but with dangerous consequences for the environment and public health. With the dramatic expansion of renewable energy technologies over the last decade, power sources like wind, solar, and geothermal have offered a more sustainable—and increasingly more affordable—path forward.

Several factors contribute to the expansion of clean energy. For one, technological advancement in renewables has made energy production and storage more efficient than ever before. The renewables industry has also received a boost from public policies and investments enacted by governments worldwide seeking to decarbonize in response to the threat of climate change. These developments have helped bring down renewable energy production costs over time, allowing market forces to spur continued growth in the sector. In all, electric power generated from renewables in the U.S. has grown by more than 70 percent since 2010.

And although growth is occurring across many renewable sources, wind and solar have been the most prominent success stories of recent years. In 2007, wind accounted for about 35 million Megawatt-hours (MWh) of electricity produced in the U.S.; since then, wind production has increased by an average of around 20 million MWh per year, rising to nearly 295 million in 2019. Meanwhile, solar is the fastest-growing of all renewables. Solar production constituted less than 1 percent of renewable energy until around 2010, but experts now project that by 2050, solar and photovoltaic energy will account for nearly half of all renewable electricity production.


Growth in renewable energy production in the U.S. is widespread, but unique features of each region mean that the transition to renewables looks different from state to state. Measured by the proportion of total electricity generated from renewable sources, states in New England and the Western U.S. surpass the rest of the country, largely as a result of renewable-friendly state policies. Vermont generates a remarkable 99.9 percent of its electricity from renewables.

In terms of total electricity produced from renewables, California (97 million MWh), Texas (91 million MWh), and Washington (74 million MWh) are the national leaders. Physical geography explains much of these three states’ strength in renewables. California is the largest producer of geothermal (with the world’s largest geothermal field) and solar (due in part to large installations in the Mojave Desert). With plenty of cheap land and strong wind in many of its regions, Texas dominates the U.S. in wind production. And in Washington, major water features like the Columbia and Snake Rivers provide the basis for the nation’s strongest hydropower sector.

To identify the states with the fastest-growing renewable energy sector, researchers at FilterBuy used data from the U.S. Energy Information Administration to calculate the percentage change in renewable electricity production between 2010 and 2019. The researchers also calculated what percentage of total electricity production is accounted for by renewables, as well as the largest renewable energy source currently.

Here are the states with the largest increase in renewable energy production.

State Rank Percentage change in renewable energy production (2010-2019) Total renewable energy production 2019 (MWh) Total renewable energy production 2010 (MWh) Renewable energy share of total production 2019 Renewable energy share of total production 2010 Largest renewable energy source


Kansas     1      511.0% 21,218,058 3,472,565 41.7% 7.2% Wind
Nebraska     2      379.7% 8,667,568 1,807,009 23.2% 4.9% Wind
Oklahoma     3      377.6% 33,281,621 6,968,743 39.1% 9.6% Wind
New Mexico     4      310.1% 8,496,851 2,071,802 24.2% 5.7% Wind
Rhode Island     5      228.5% 472,344 143,779 6.2% 1.9% Biomass
Texas     6      213.9% 90,922,198 28,966,660 18.8% 7.0% Wind
Ohio     7      189.8% 3,272,411 1,129,113 2.7% 0.8% Wind
Utah     8      188.6% 4,261,269 1,476,479 10.9% 3.5% Solar
Illinois     9      186.4% 15,057,518 5,256,702 8.2% 2.6% Wind
Colorado     10      173.6% 14,043,640 5,132,797 24.9% 10.1% Wind
Iowa     11      155.7% 26,356,275 10,308,651 42.7% 17.9% Wind
Nevada     12      155.3% 11,345,373 4,443,943 28.4% 12.6% Solar
North Carolina     13      144.3% 16,709,383 6,839,691 12.7% 5.3% Solar
Michigan     14      143.3% 9,932,713 4,083,005 8.5% 3.7% Wind
North Dakota     15      134.0% 14,392,502 6,150,146 35.0% 17.7% Wind
United States     –      70.3% 727,696,543 427,376,077 17.6% 10.4% Wind


For more information, a detailed methodology, and complete results, you can find the original report on Filterbuy’s website: https://filterbuy.com/resources/states-largest-increase-renewable-energy/